
![]()
In this first COG Power BI Tips series we are going to be looking to convert a regular date column to a GOC fiscal year. Typically this might be done with a lookup table but I am going to show you how to do it programmatically with some simple query parameters and DAX.
Pre-requisites
So I am going to assume the reader can (in Power BI):
- upload an excel data set
- open the query editor to add new columns
- add a calculated column and is familiar with basic DAX
Getting started
The Power BI file is embedded as an interactive chart at the end of this post. Also here is a link to the excel file so that you can build it from scratch.
I recommend that you download the spreadsheet and start a new Power BI file to implement this from scratch as working exercise.
Once you have downloaded the files open a new Power BI and connect to the Excel file. Rather than Load hit the edit button to get to the Power Query edit screen.
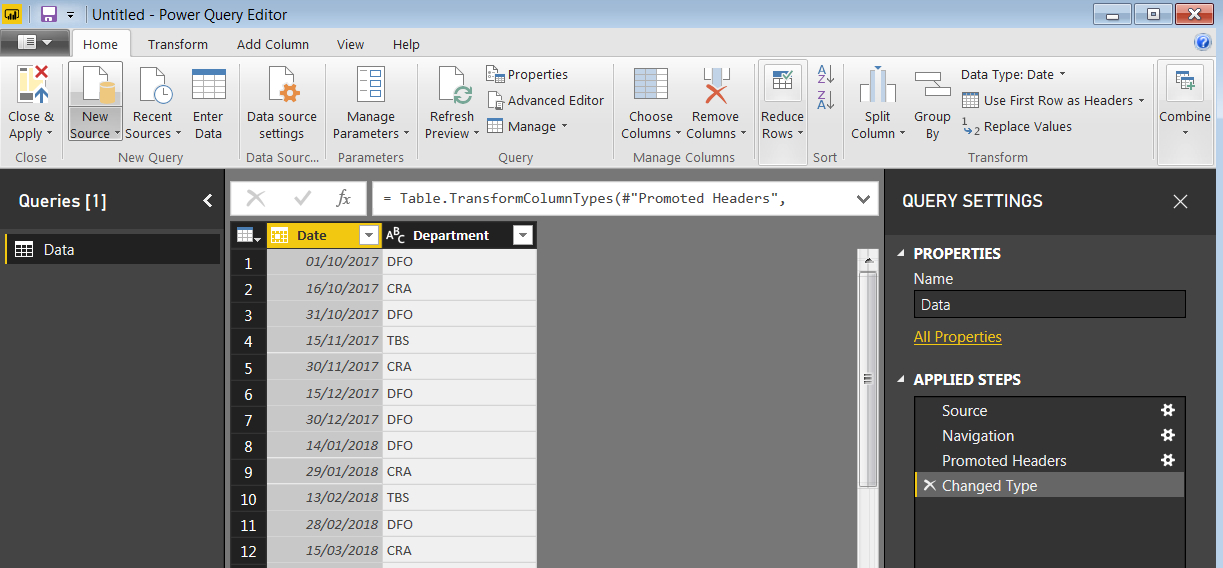
You will see that the spreadsheet only contains 2 columns of data, column A is a list of dates and column B is a list of Departments.
Setting up the query and add year and month columns
So you should see the following when you open the query editor:
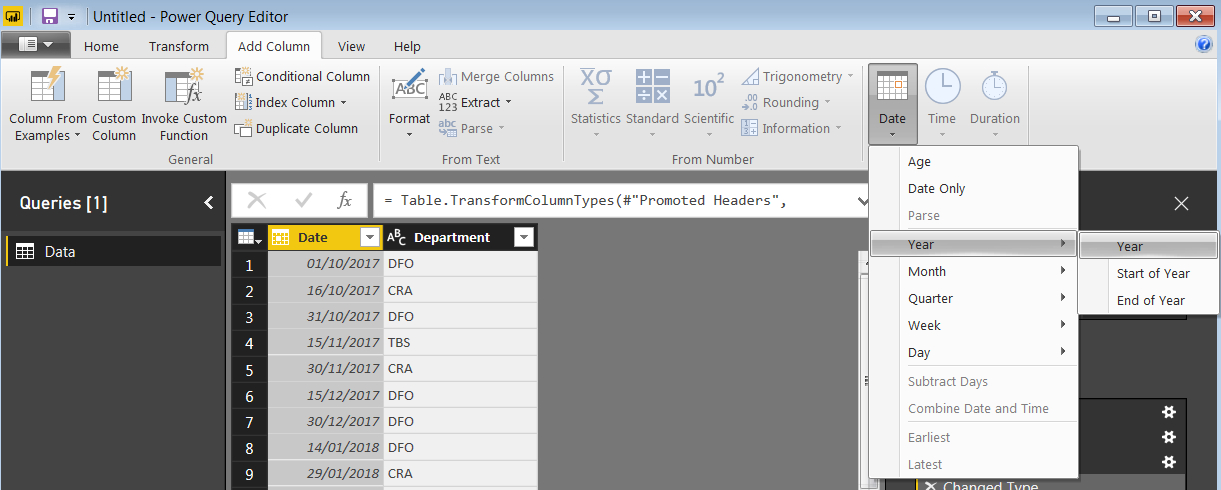
We now want to add 2 new columns. The first is a column of the year and the second is a column of the month. We will use this in our DAX later on to create the fiscal year.
To do this:
- Click on “Add Column” in the ribbon
- Click on the Date column to make sure that it is highlighted
- Click on the “Date” button on the top RHS of the ribbon
- To add the “Year” column click on Year, then in the sub menu “Year” again
- To add the “Month” column click on the “Date” button again, then “Month” and in the sub menu “Month” again
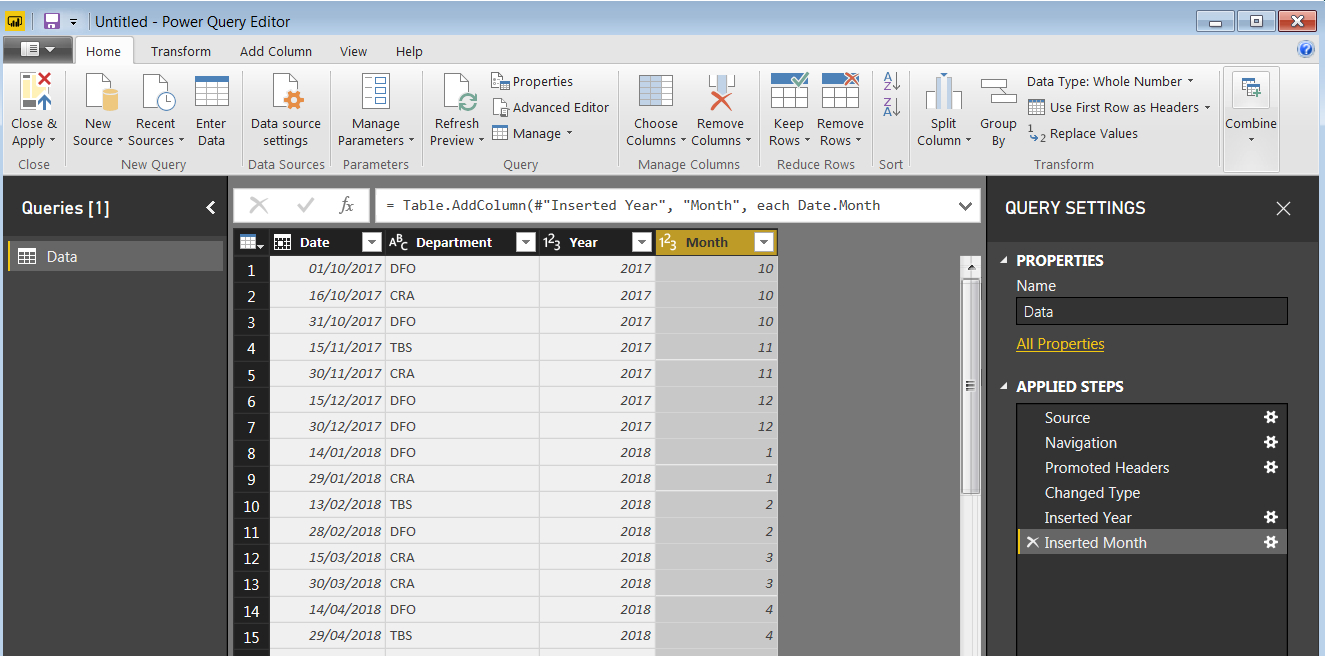
Once you are done your query should look like this. If it does then click on “Home” then “Close & Apply”.
Setting up the calculated column
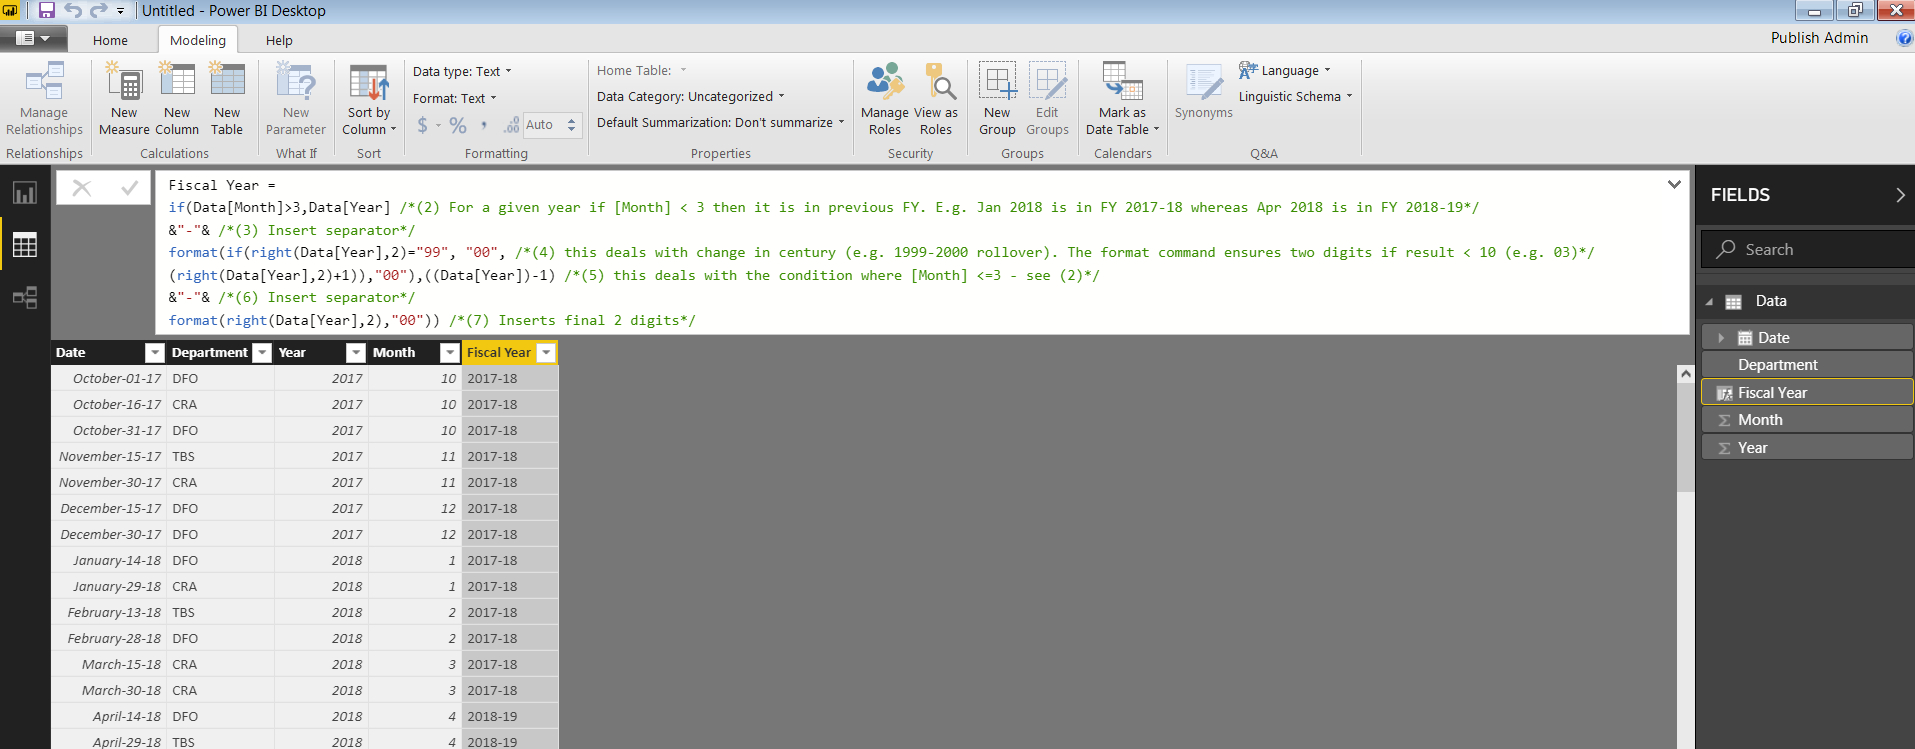
What we now need to do in Power BI is to add a new calculated column that automatically creates a fiscal year from the columns of data in the data set. To do this go to the “Modeling” tab and then click on “New Column”. Once you have done that cut and paste the following DAX into the Column text field (the green text is inline notes, the black is the DAX code) :
Fiscal Year =
if(Data[Month]>3,Data[Year] /*(1) For a given year if [Month] < 3 then it is in previous FY. E.g. Jan 2018 is in FY 2017-18 whereas Apr 2018 is in FY 2018-19*/
&"-"& /*(2) Insert separator*/
format(if(right(Data[Year],2)="99", "00", /*(3) this deals with change in century (e.g. 1999-2000 rollover). The format command ensures two digits if result < 10 (e.g. 03)*/
(right(Data[Year],2)+1)),"00"), /*(4) this deals with the condition where [Month] <=3 - see (1)*/
((Data[Year])-1) /*(5) this returns the "Year-1" is the month is Jan - Mar*/
&"-"& /*(6) Insert separator*/
format(right(Data[Year],2),"00")) /*(7) Inserts final 2 digits*/
With the format of the column being XXXX-YY e.g. Oct 1st 2017 would be returned as “2017-18” in the calculated column.
So what is going on here?
As fiscal years work based on a March 31 end date we need to build in some logic to do the following
- 31 March 2018 fiscal year is “2017-18”
- 1st April 2018 fiscal year is “2018-19”
So at the beginning of the DAX we are performing this month check and then the code (follow the code notes) will pull from the “Year” column and use the Year value that is there for a date Apr – Dec, or “Year-1” value for Jan to March.
The “format” commands in the code ensure that the second part of the fiscal year after the separator has 2 digits, even if we are returning a result that is less than 10 (i.e. 8 vs 08).
Putting these 2 together ensures that we will always return the correct fiscal year without having to use a cross reference table.
You should see the new column like this:
You can now add in whatever charts that you want, just double check the sort option when you add in “Fiscal Year” to an element. In the published Power BI file blow I show three that demonstrate two column charts, date (top) vs fiscal year (bottom). The table shows the data as a side by side comparison.
Coming next in GOC Power BI tips #2: How to automatically generate a GOC Fiscal Period, Month and Quarter.
Please leave questions in the comments or contact us if you want to know more. If you are interested in getting to know Power BI or to have some more advanced training check out our Data Engineering and Tools workshops.
Hello.
Is there an added value to create the fiscal year column with DAX, rather then creating it in Power Query with M ?
Actually doing it in Power Query with M is likely more efficient but users in this environment tend to be more fluent / comfortable in DAX rather that M so a lot of the solutions are DAX related. It would be good for us to do a follow up blog post doing this in M so people have a comparison.
Thanks for the feedback