
![]()
So this is a “stepping stone” post that will take us to the next blog in which will create a French Date column that is automatically translated from a regular date column. Even though this is an interim step, having a translated French Month column can, in itself, be useful.
We assume in all of these posts that you have completed the exercises in the previous GOC Power BI tips series. If not I suggest that you go back and do those because we are going to rely on a pbix file with some queries and calculated columns from those posts.
Getting started
So let’s take our previous pbix and look again at the query as a refresher. We can see that we have taken a date column and extracted the Year, Quarter and Month numbers.
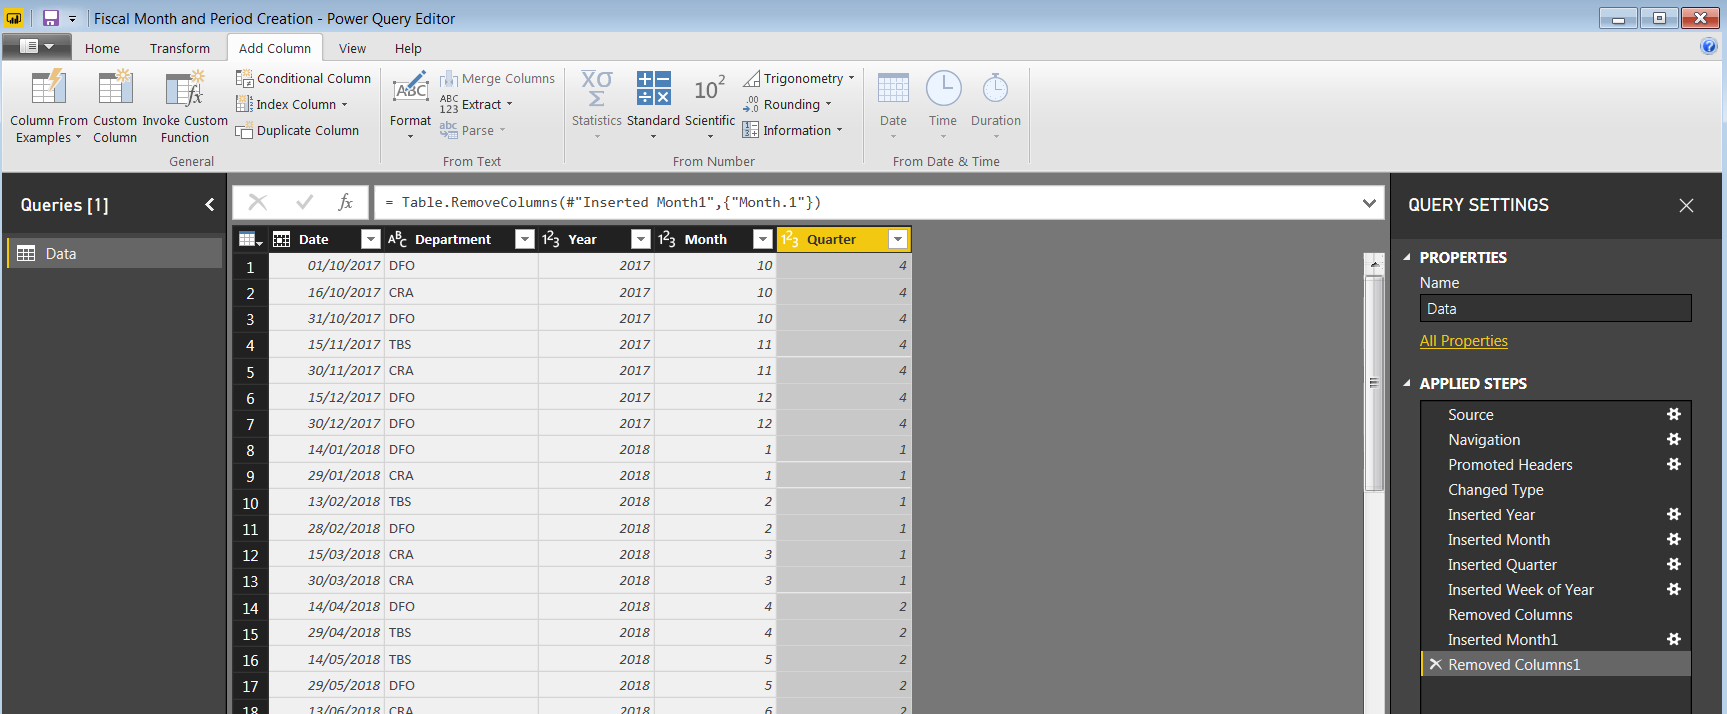
So we can close and apply this data and we can now get to the next step…
Adding a translation cross reference table
So we are now going to create a new table, we can do this from Excel (or similar) but to be REALLY simple we are just going to cut and paste the table below as a new table in Power BI.
Firstly highlight and copy the data from the table below. Note that technically all we need is the “Month #” and “Month Fr” columns BUT I have built this out to give a little more future flexibility. Also note that this doesn’t have to be French, add in whatever language you want, even as multiple columns so you can do this for multiple languages:
| Month # | Code Fr | Month En | Month Fr | Abb En |
| 1 | JA | January | janvier | Jan |
| 2 | FE | February | février | Feb |
| 3 | MR | March | mars | Mar |
| 4 | AL | April | avril | Apr |
| 5 | MA | May | mai | May |
| 6 | JN | June | juin | Jun |
| 7 | JL | July | juillet | Jul |
| 8 | AU | August | août | Aug |
| 9 | SE | September | septembre | Sep |
| 10 | OC | October | octobre | Oct |
| 11 | NO | November | novembre | Nov |
| 12 | DE | December | décembre | Dec |
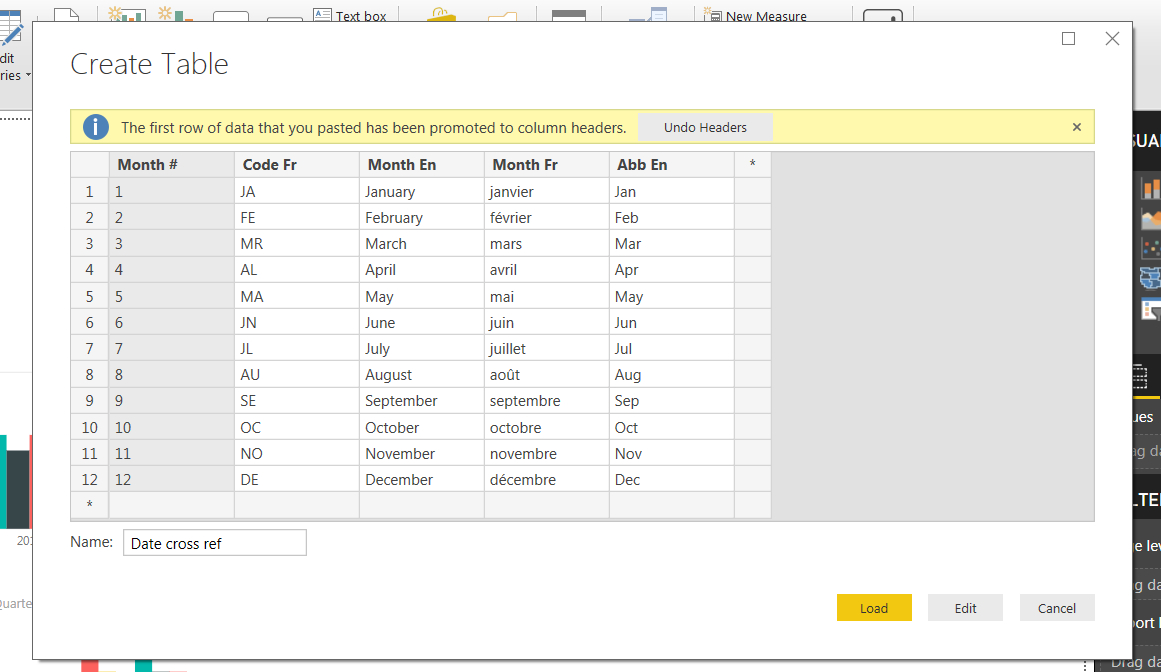
Once you have copied the data click on the “Enter Data” button in the Power BI ribbon and pate the data into the table.
Before you hit save make sure you rename the table “Date cross ref”. You can name it what you want but the DAX below uses that name as a reference so remember to change the DAX if you change you table name. Before you hit save you should see the following in Power BI:
Power BI should have automatically detected the relationship between “Month #” in this table and “Month” in our “Data” table. To check that it has click on the relationship button in Power BI and look at the two tables. There should be a line between them. Double click on this line and the “Edit relationship” box will appear. Check that is looks like the picture below:
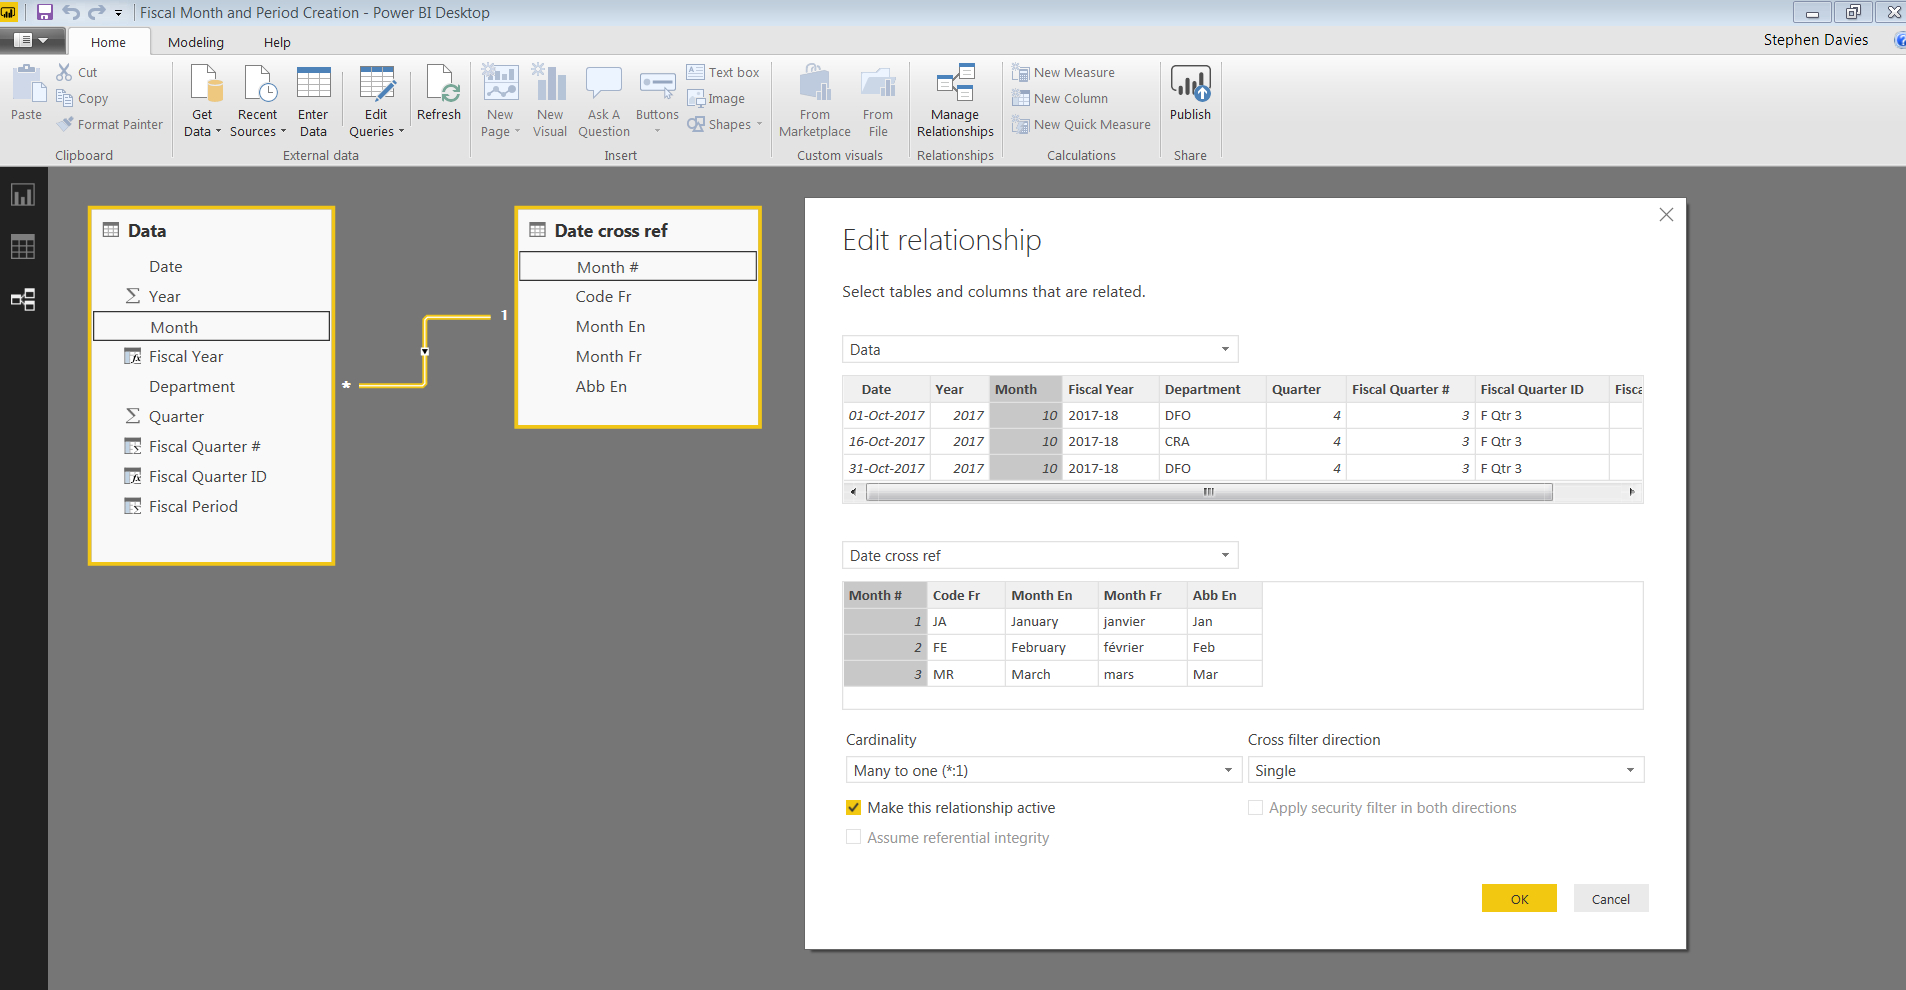
If you need a refresher on creating relationships in Power BI check out this Microsoft post that gives you the details.
Adding in a translated Calculated column
What we need to do next is to add a column in our Data table that contains the Month in French. To do this we are going to use the DAX “RELATED” function that will look at cross reference table, match the month number then insert the French translated value.
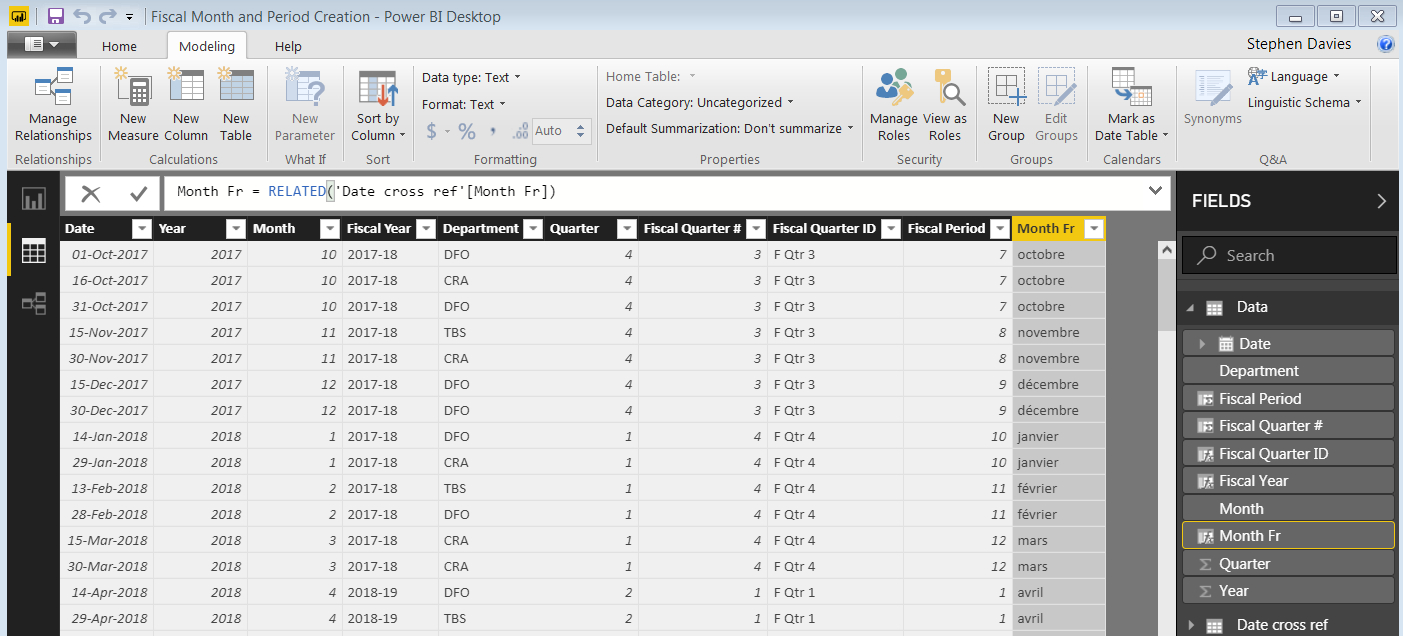
So go to the data view tab in Power BI, click on “Modeling”, then “New Column” and paste the following DAX into the text field:
Month Fr = RELATED('Date cross ref'[Month Fr])
You should now see the following:
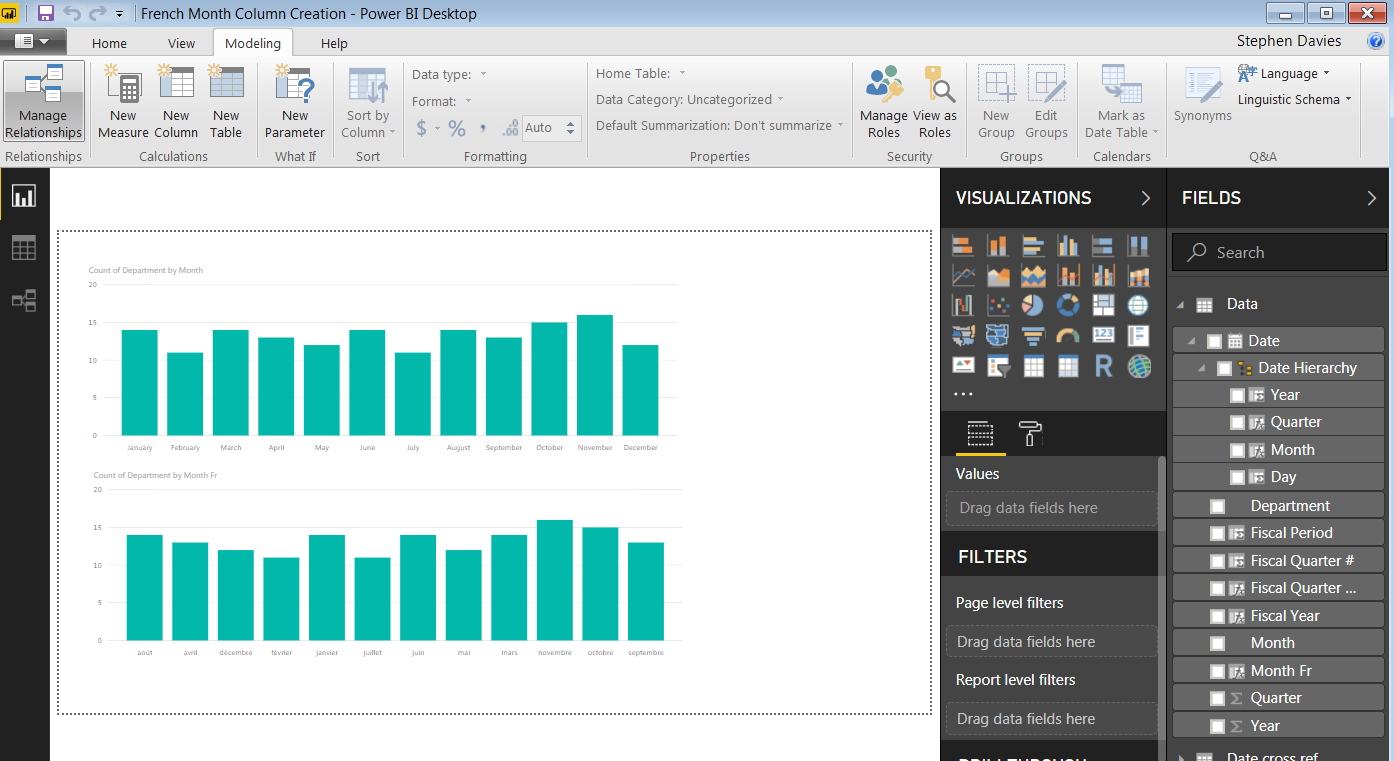
Now we have one problem to overcome. As this field is a text field and not a native date field any charts will automatically sort alphabetically. We need to play one more trick to get the months to sort in date order. The picture below shows two identical column charts, but as you can see the French month on the bottom is in alphabetical order:
There are a number of support posts on how to do a manual sort but I will show you quickly how to do it.
- In your Power BI file create similar charts
- Click on the graph using the French month as the axis
- On the right in the “Fields” section click on any of the data fields
- Make sure you have the “Modeling” ribbon open. You should see the “Sort by Column” button go from greyed out to active. Click on this and select “Month”, you should see the following:
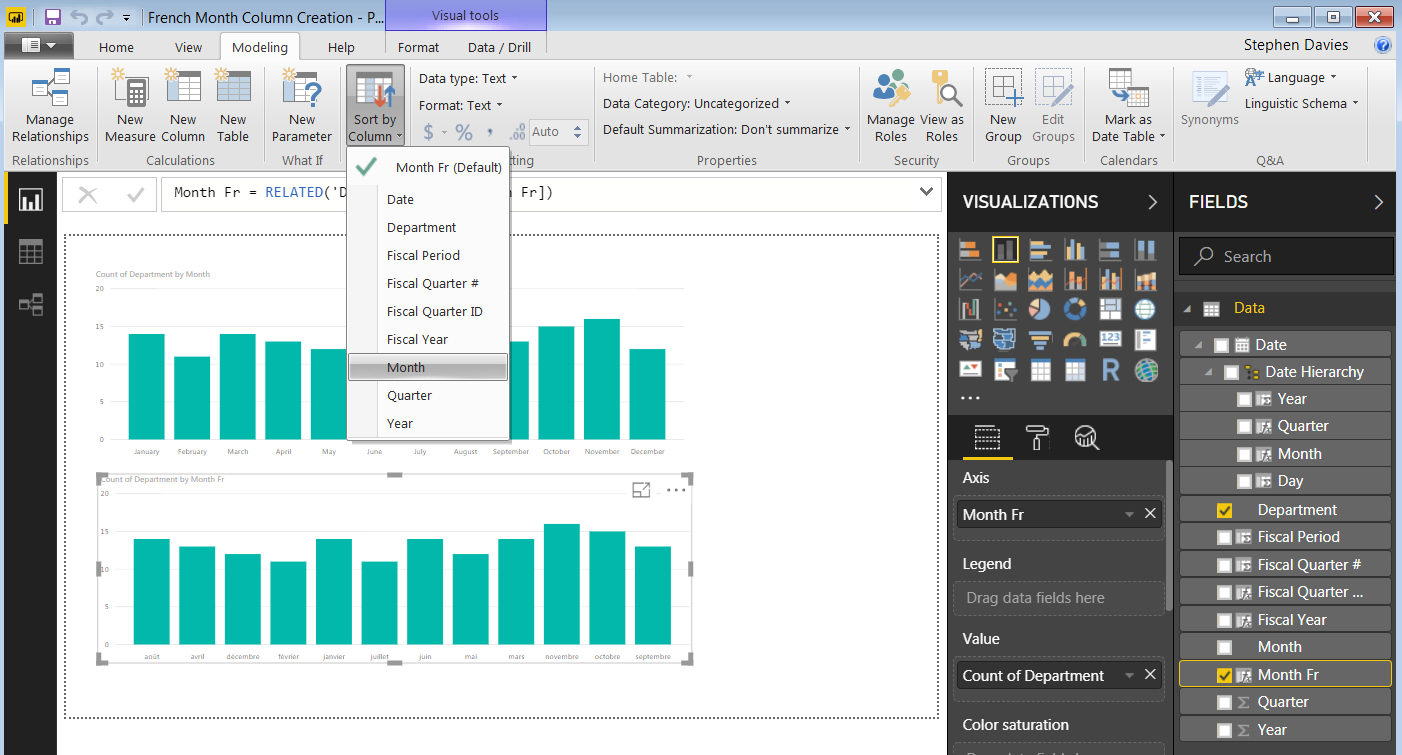
Once you have done this the chart will now be sorted in the correct way. Take a look at the embedded Power BI visualization below to check it out:
Coming next in GOC Power BI tips #4: How to automatically translate an English date column to a full French date column (or any other language that you choose!).
Please leave questions in the comments or contact us if you want to know more. If you are interested in getting to know Power BI or to have some more advanced training check out our Data Engineering and Tools workshops.