
All training courses are provided in-house and the courses listed below can be mixed to meet your needs.
Please contact us to discuss what courses would best match your requirements and if you have any questions on specific courses or course categories.
Data Visualization for Analysis
Data visualizations can be used for reporting endeavours in a variety of manners, but they can also be used to explore data and set the stage for more in-depth analysis, and for insight extraction. In this module, participants will
- Learn about the different roles of data visualization in the data analysis process.
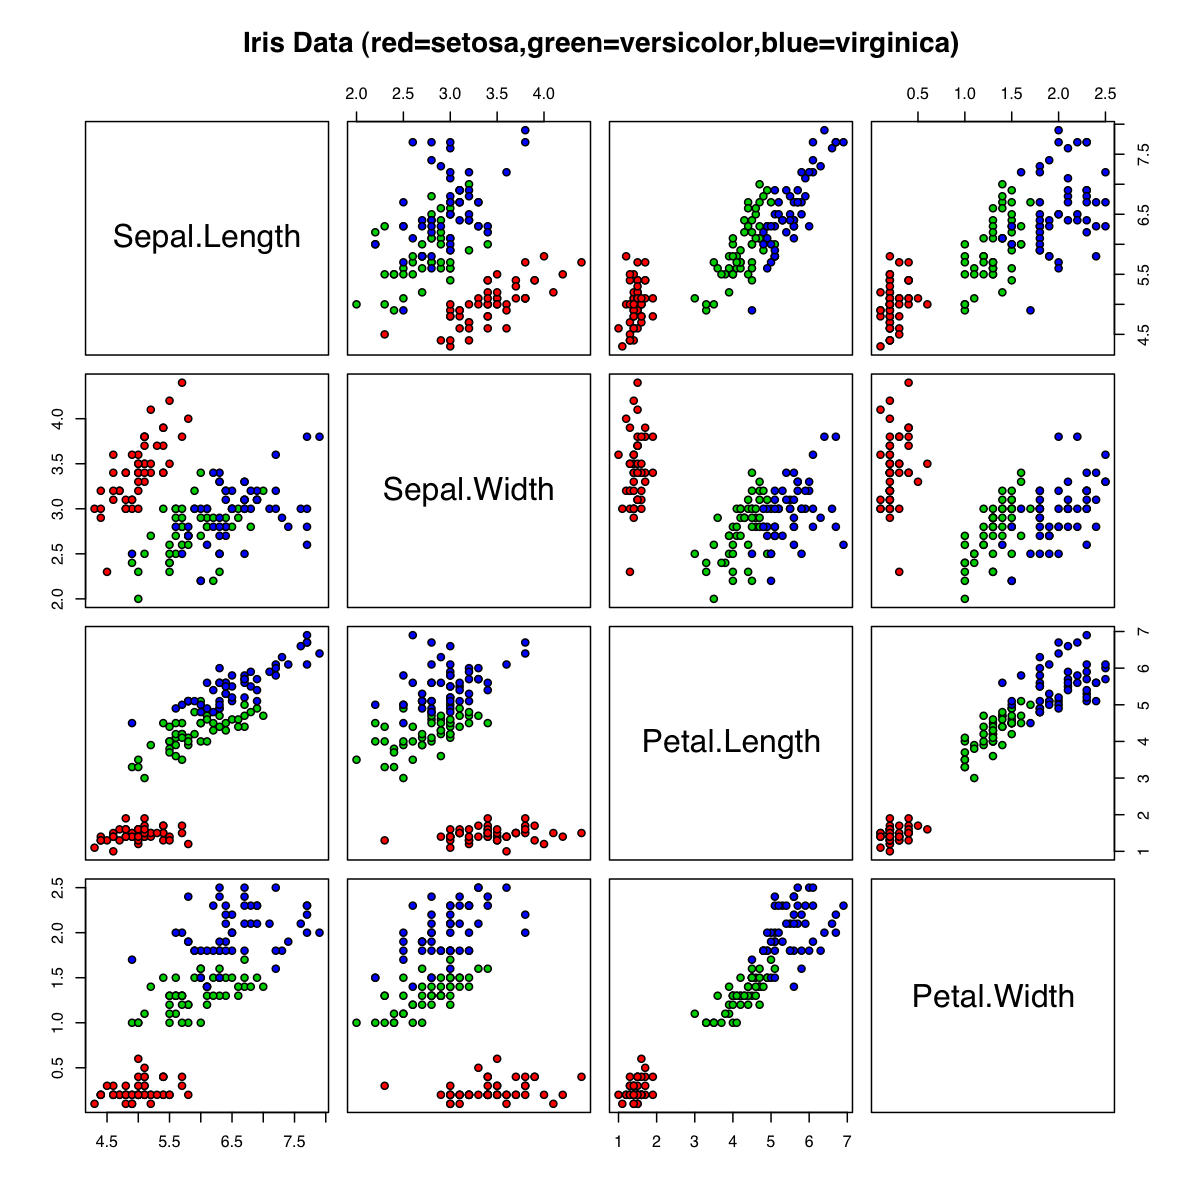
- Increase their understanding of how to represent simultaneously multiple dimensions.
- Learn some of the strategies and considerations used to create good post-analysis visualizations.
- Learn the difference between a visualization and an infographic.
- Improve their judgment about the quality of data visualizations.
In particular, participants will study the use of data visualizations for
- Detecting anomalous and invalid entries
- Shaping data transformations
- Getting a sense for the data
- Identifying hidden data structure
They will also study the fundamental principles of analytical design and learn how to recognize their application in a number of case studies, Finally, they will study the grammar of graphics.
Category:
Data Visualization
Product Code:
DV-6
Course Duration (hours):
8