
![]()
So following on from our last post where we took a regular date column and converted it into a GOC fiscal year, in this post we are going to automatically create GOC quarters (Qtr 1 = Apr-Jun, Qtr 2 = Jul – Sep, Qtr 3 = Oct – Dec, Qtr 4 = Jan – Mar) and fiscal periods (April to Dec is 1 – 9, Jan to Mar is 10 – 12).
We can return to the Power BI file and the dataset that we used last time. If you have not done that click here to pop back to that last post.
Getting started
Ok so the first thing we have to do is to go back to our query so open the Power BI from before and click on “Edit Queries”.
As you will see in your data we have already created a “Month” column which we need for the fiscal period calculation we just need to add “Quarter”. As before navigate to the “Add Column” button on the ribbon then select the date button, click on “Quarter” and “Quarter” again in the sub menu. Once done you should see the following:
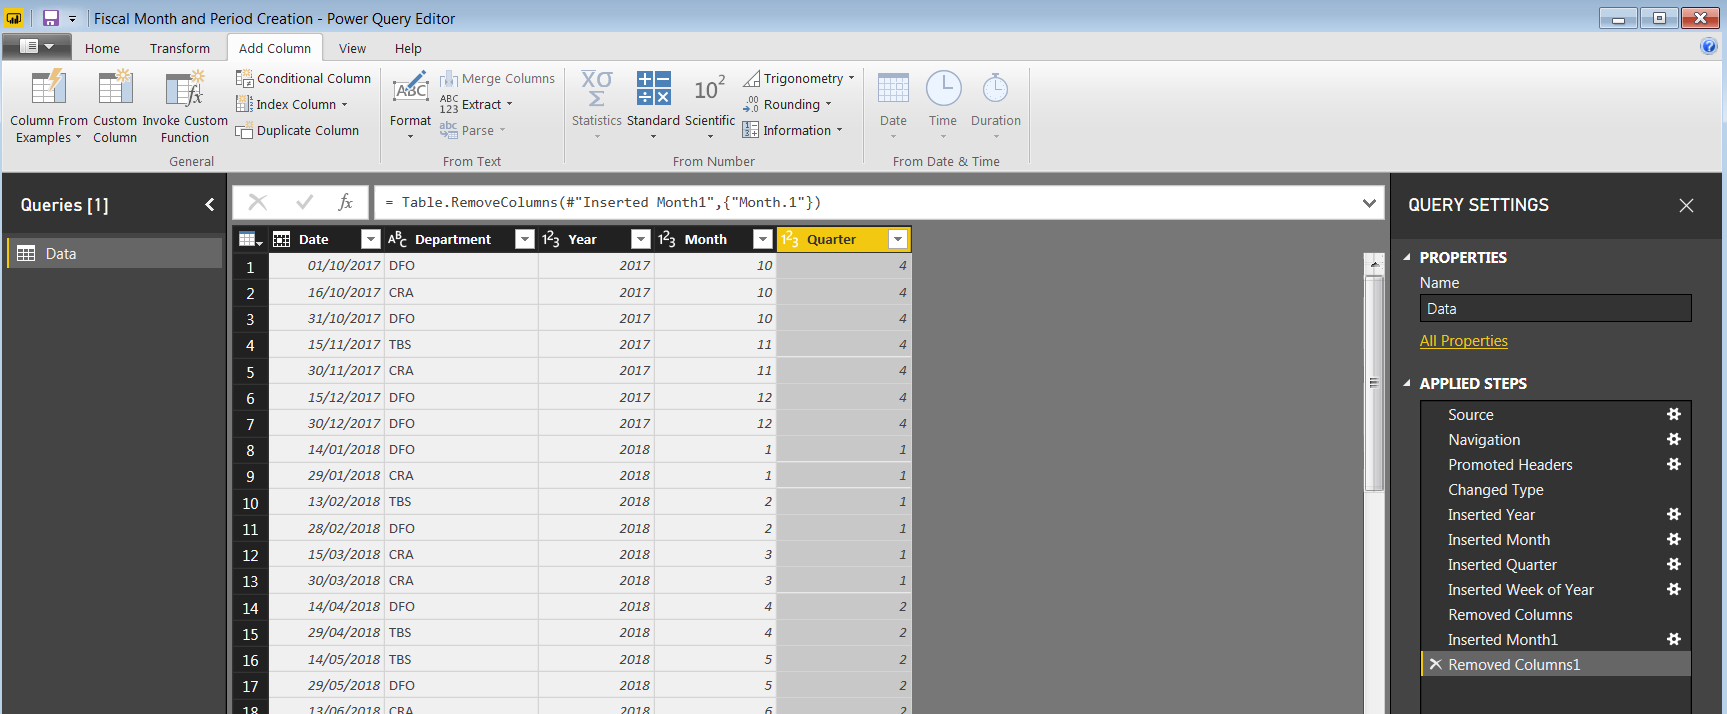
If you see the same then click on “Close and Apply” so we can get to the DAX code.
Adding a Fiscal Quarter Calculated Columns
We are in fact going to add 2 columns. The first is just going to be a number (1 – 4) of the quarter as this may be useful in some instances (for certain analysis or types of graphs) but we are also going to add a second calculated column that has a “F Qtr” prefix so if we use it on a graph axis it is self explanatory. NOTE that you can change the “F Qtr” to whatever you want in the code.
So as before in the Power BI data screen click on “New Column” button and in the text field add in the following DAX:
Fiscal Quarter # = if(Data[Quarter]=1, Data[Quarter]+3, Data[Quarter]-1)
All we are doing here is a logic check. If the Quarter is 1 then we are adding 3 (because calendar quarter 1 is fiscal quarter 4). If it is anything else we are simply taking 1 from the value (calendar quarter 3 is actually fiscal quarter 2). Simple eh!
Next we would like to make this readable on a graph so we are going to create a new column that has the “F Qtr” prefix. We COULD do this all in one go but in my experience having the 2 columns as options is very beneficial.
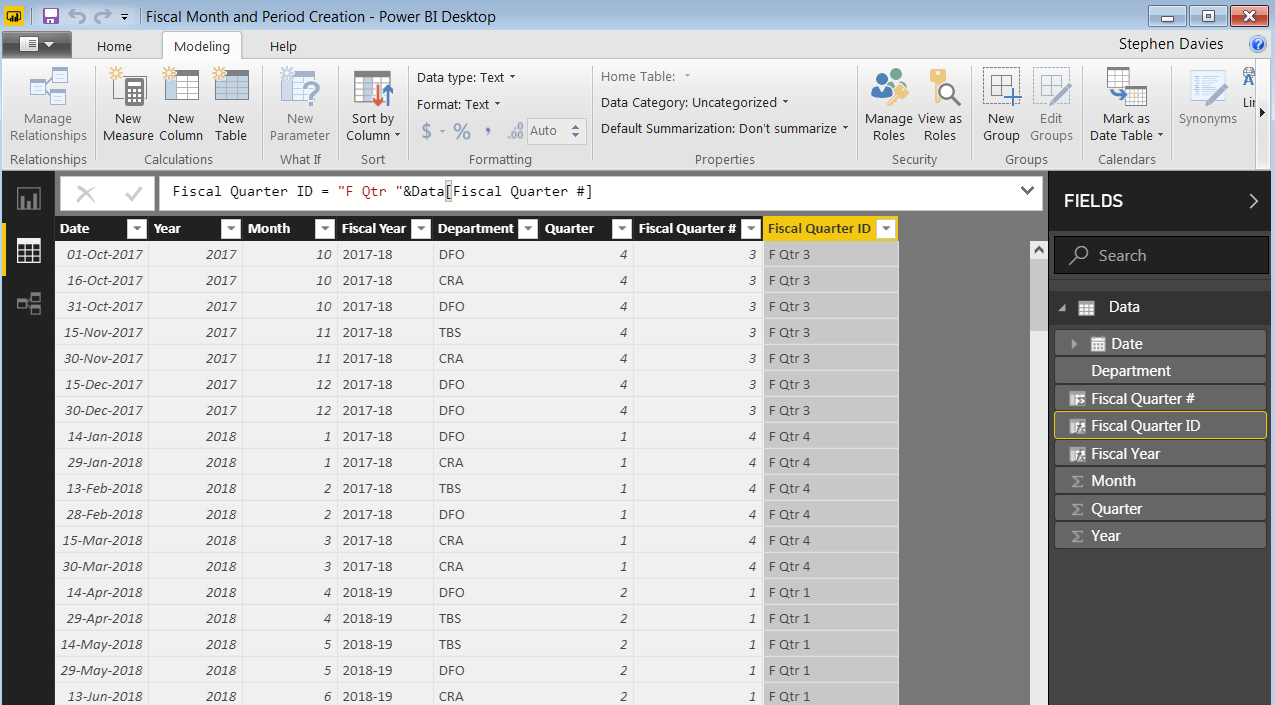
So click on “New Column” again and paste the following DAX:
Fiscal Quarter ID = "F Qtr "&Data[Fiscal Quarter #]
Once done you should see the following:
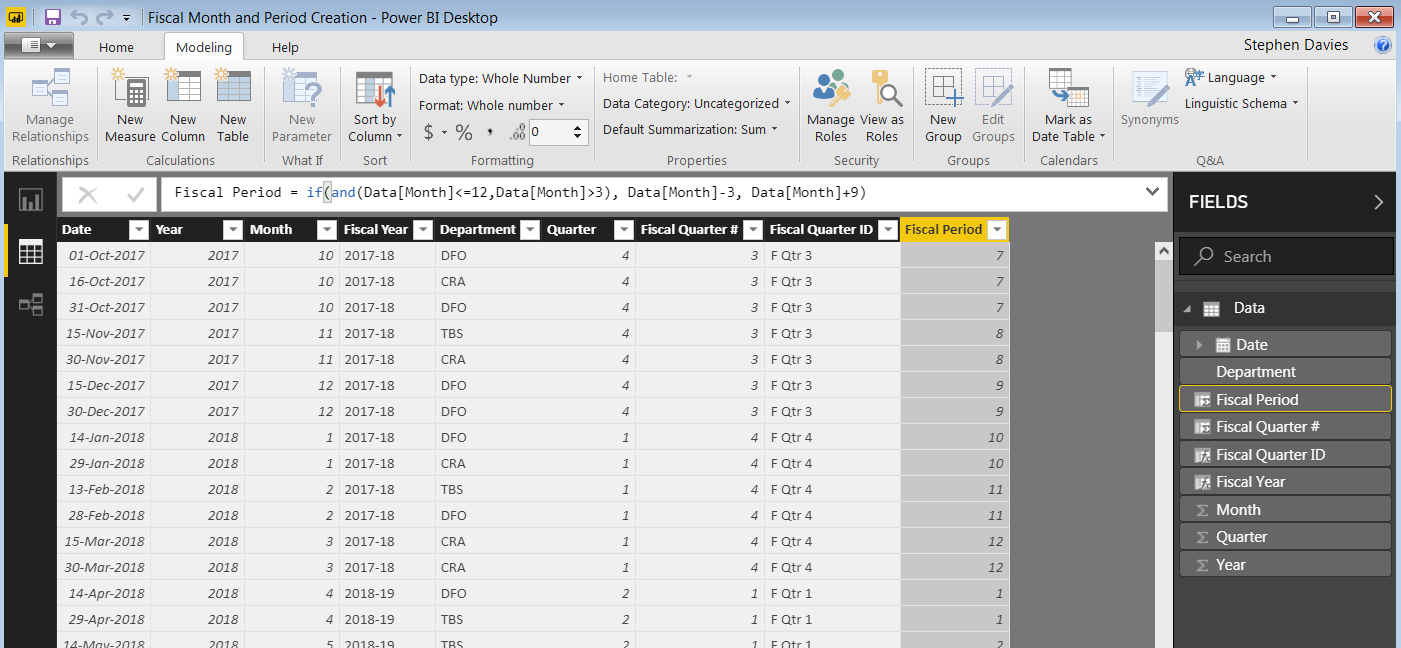
Great, so we are now going to add a fiscal period column in the same way by pasting the following DAX:
Fiscal Period = if(and(Data[Month]<=12,Data[Month]>3), Data[Month]-3, Data[Month]+9)
So this is essentially the same logic as the fiscal quarter. We are looking so see if the month number is between 3 and 12. If so then we subtract 3, if the month is 1 – 3 then we add 9. Believe me the logic is correct and you get the correct fiscal period! So now your data should look like this:
Ok so let’s build a couple of visualizations that show different ways of using this new information. See the embedded Power BI file below to see a couple of simple charts. The top column charts gives a count of department by calendar year, subdivided by quarter. The bottom chart counts department by Fiscal Year subdivided by Fiscal quarter. The block of boxes on the RHS are simple slicers to filter the data quickly. The matrix on the bottom shows Department count, Fiscal Year against Fiscal Period.
Coming next in GOC Power BI tips #3: Automatic Translation of an English Month to French (or any other language that you choose!).
Please leave questions in the comments or contact us if you want to know more. If you are interested in getting to know Power BI or to have some more advanced training check out our Data Engineering and Tools workshops.