
![]()
In this post we will look at taking a regular date column and turning it into a French Translated date. You should have worked through the previous posts as we will be using the pbix file that was created in GOC Power BI tips #3 – Automatic translation from an English to a French Month.
Getting started
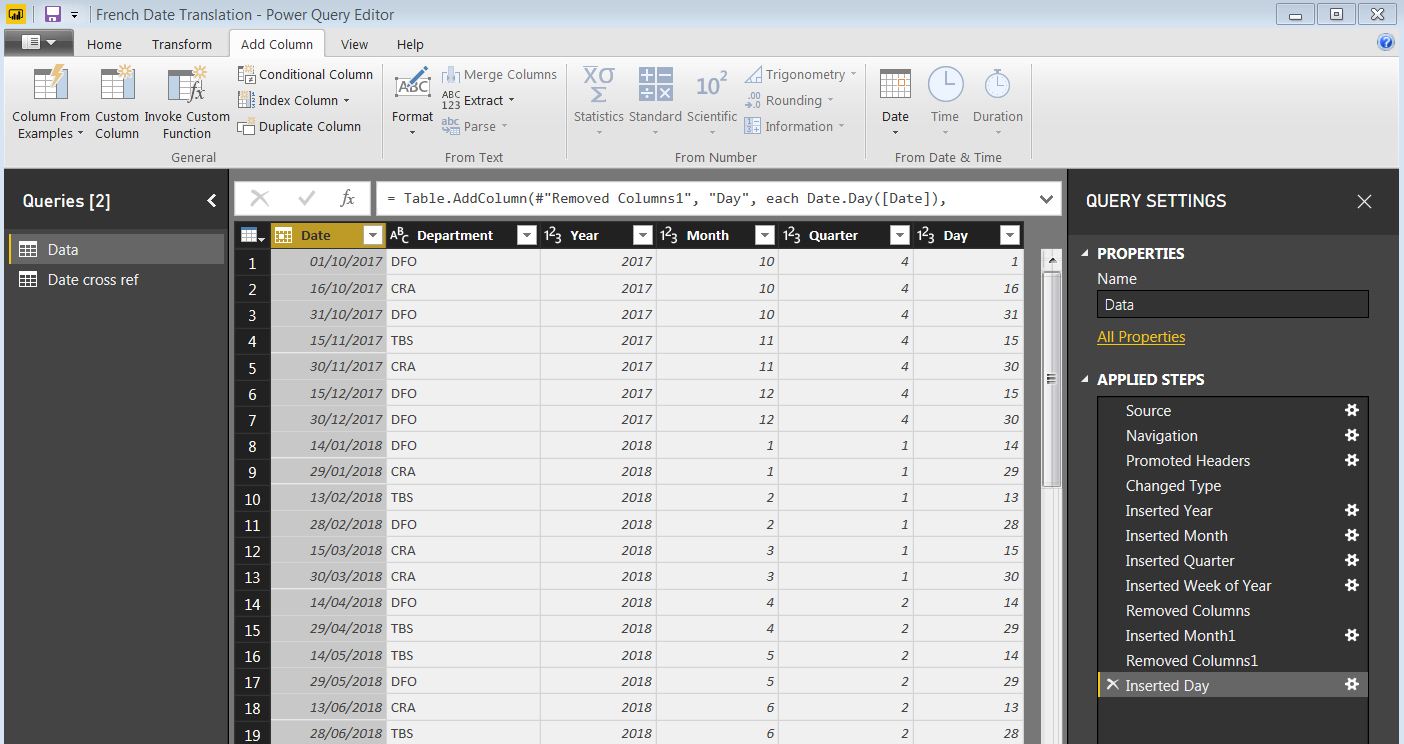
In our previous posts we took the date and Department data and in the Power BI query screen we added Year, Month and Quarter. Using the same process you now need to add a “Day” column.
To recap (in the Power BI query screen) you do this by highlighting the “Date” column, then click on “Add Column”, then click on the “Date” button in the ribbon, then “Day” and again “Day” in the sub menu items. Once you have done this you should see the following:
Once you are good with that hit “Home” then “Close and apply” to get into Power BI.
Adding in calculated columns to do the translation
So in the previous post we entered a translation cross reference table, if you have not done that exercise I suggest that you go back and complete that. Assuming that you are good, we now have to create a new Calculated column and add in the following DAX:
Calendar Date Fr = Data[Day]&" "&Data[Month Fr]&". "&Data[Year]
Once you have done that you should see the following:
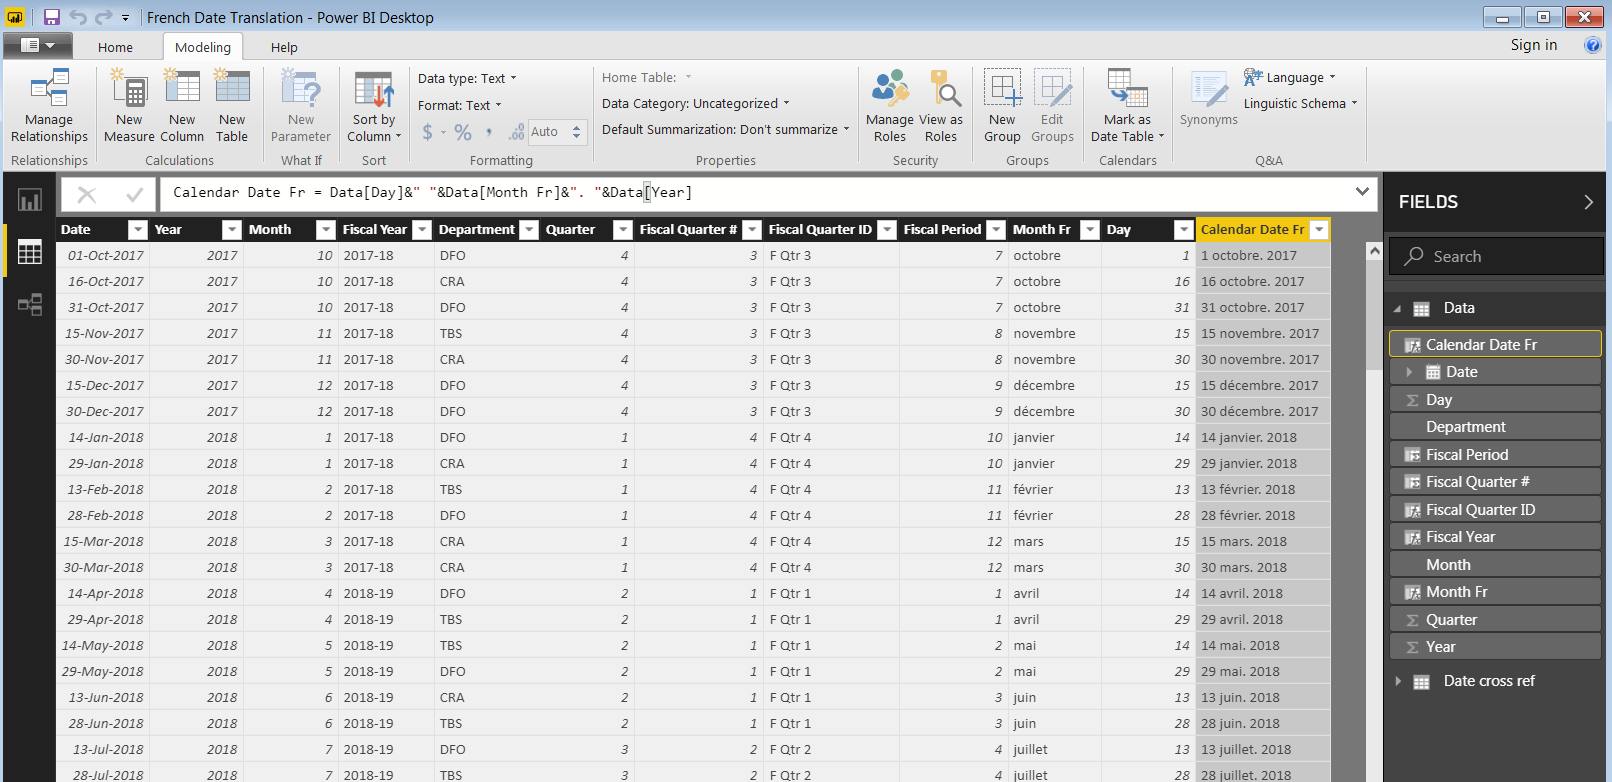
NOTE that for this to work you need to have added the Calculated column “Month Fr” from the last post.
So what is going on here?
We are combining three separate columns into a single column using the “&” operator – namely the “Day”, “Month Fr” and “Year” columns – simple as that!
We still have the same sorting issue that we did in our last post, the fact that this is a text column and not a native date column means that we need to force a manual sort on our graphs. The other disadvantage with this approach is that Power BI will not build an automatic date hierarchy. I will show you how to do build a manual date hierarchy in a follow up post.
Final note: This is NOT as flexible as changing the language and building all of your charts in French, as this is a text field there are certain limitations (most of which can be solved by manually building a French date hierarchy) but you might not get all of the behaviours you want from all of your charts.
In my experience though the ability to build a set of charts in which you can dynamically switch between English and French outweighs the limitations. See below for a Power BI file I created, it has a simple table that shows the dates vs fiscal year (for count of Department). Have a play and see what you can come up with!
Coming next in GOC Power BI tips #5: Dynamically changing between English and French on your visualization.
Please leave questions in the comments or contact us if you want to know more. If you are interested in getting to know Power BI or to have some more advanced training check out our Data Engineering and Tools workshops.