
ABSTRACT
Climate change is altering the production possibilities available to farmers.
Studies in specific regions and focusing on specific crops indicate unfavorable effects for Canada. Other more collective studies aimed at determining the impact of climate change on agriculture in Canada indicate beneficial effects (MARIAN WEBER, Alberta Research Council Edmonton, Albert).
My project examines the consequences of climate change on Canadian production specifically (wheat and Barley). The values of climate components such as average annual temperature and precipitation, and agricultural production per year will be used to generate regression analysis (OLS) and descriptive statistical analysis to be able to assess and understand the effects.
INTRODUCTION
Climate change has already resulted in both negative and positive impacts on global crop yields with the former being more common than the latter (IPCC 2014). For example, between 1981 and 2008, observed warming has negatively impacted maize and wheat yield in many regions, especially in tropical climates, causing global average yields to decline by 3.8% and 5.5%, respectively (Lobell et al 2011). The combined annual losses of these two crops together with barley represent a 40 million tonnes (Mt) per year loss, roughly 2%–3% of the total global production (Lobell and Field 2007). Some studies found positive effects of climate change in high-latitude regions, such as northeast China and the UK (Chen et al 2010, Supit et al 2010); yet even in regions with positive effects, it is unclear if the benefits would continue into the future with continual warming. Since Rosenzweig and Parry (1994) produced the first assessment of climate change impacts on global food supply, numerous studies have shown potential negative impacts, especially of rising temperature, on global crop yields (e.g. Challinor et al 2014, Asseng et al 2015, Liu et al 2016, Zhao et al 2017). It has been reported that for the major crops (wheat, rice and maize) in tropical and temperate regions, climate change without adaptation would negatively impact production for local temperature increases of 2 °C or more above late-20th-century levels, although certain locations may benefit (IPCC 2014). The potential negative impact of climate change on global crop yields and production raises great concern for future global food security (Wheeler and von Braun 2013).
Canada presently plays a crucial role in global food supply, acting as the world’s fifth largest exporter of agriculture and agri-food products after the EU, the US, Brazil, and China (Agriculture and Agri-Food Canada 2016). Total agricultural land in 2016 was 64.2 million hectares (MH), representing 7% of Canada’s land area with prime farmlands mainly concentrated in the Prairie ecozone and Ontario. Considering Canada’s total land area, many factors can help explain why only a small proportion of the available land area is suitable for farming. Sub-optimal climatic conditions such as low temperature and limited solar radiation in high latitudes, low soil fertility, topography and soil quality all limit the northward expansion of agricultural production. Thus, for Canada, longer growing seasons and increased crop heat units under global warming (Qian et al 2012) will primarily be of benefit for land already in crop production under global warming.
Previous studies (Rosenzweig et al 1993, Wang et al 2012, Smith et al 2013, Qian et al 2016a, 2016b) projected an increase in spring wheat yield (grown mainly on the Canadian Prairies) under future warmer cli- mates in the 2050s due to direct effects of elevated atmospheric CO2 concentration. Maize yields in southern Ontario under rainfed conditions and on the Canadian Prairies under irrigation were projected to increase (Smith et al 2013, He et al 2018). In contrast, a recent study projected potential decreases in canola yields due to increased heat/water stress at three locations, in Manitoba, Ontario and Quebec, respectively (Qian et al 2018). These projections were often only based on one crop model, driven by a limited number of climate scenarios, and thus may not have considered the wide range of uncertainties associated with both climate and crop models.
In this study we analyse the climate change impacts on two prominent crops in Canada (Wheat and Barley) for yields between 1980-2005, for the province of Alberta.
I will talk about the impact of climate change on agricultural yields in Alberta, providing a regression analysis of how the climate components I selected affect the agricultural yields in Alberta over a period of approximately 25 years, from 1980 to 2005.
These climate components include mean Total rain, mean Total snow and mean Temperature and much more which will be shown in a table.
Before getting into the methodology, we need to understand why these components were chosen specifically and their individual impacts on crops from a non-statistical point.
RAIN
Rain is usually seen as a benefit to crops and fields, but there is an “ideal” amount of rainfall in any given growing season for most crops. If the average rainfall is much lower or higher than the ideal, it can lead to significant problems, from drowned crops to lower yields.
If crops are too wet, they could also start to mold or catch a fungus. The soil can also start to collect bacteria, mold, and fungus, which can then be absorbed by the plant. While this isn’t as common in crops as it is in indoor plants, poor drainage and irrigation systems can lead to these types of growths taking control over your crops.
Along with mold or a fungus, disease can also spread amongst your crops. Rainfall is also a good indicator of predicting common crop disease, as it can affect the spread of disease. Rain can spread pathogens, pests, and other diseases to plants, leading to massive diseased crops. This could affect its yield or cause the entire field to become unusable.
Besides disease, rainfall can also determine how fast a crop will grow from seed, including when it will be ready for harvesting. A good balance of rain and proper irrigation can lead to faster-growing plants, which can cut down on germination time and the length between seeding and harvest. The crops are dependent on water during their entire lifecycle in order to survive and thrive.
Soil is also greatly affected by rainfall. If it is too wet or too dry, nutrients in the soil can run off and not make it to the plants’ roots, leading to poor growth and overall health. Additionally, as mentioned previously, overwatering or too much rain can also lead to bacteria, fungus, and mold growth in the soil.
Knowing when to water, preventing disease and mold, and making sure the soil is kept at the right moisture level are all components of the overall goal of the crops and their farmers: to have the highest crop yield possible. The right amount of rainfall can balance out these factors, which can lead to healthier, larger crops that can be harvested more fully.
Balancing proper watering is key to the best crops possible. Sigfox-enabled sensors can help farmers better track and predict weather conditions and rainfall, thus leading to better crop health.
In relation to the data I collected, below I provide a Two-way scatter plot with a line of best fit of Log Barley and Log wheat in the Y-axis and Average rainfall in the x-axis
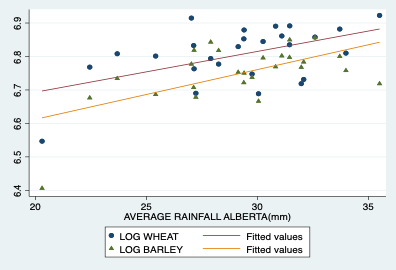
In relation to my research, this graph shows us that there is a positive correlation between Average Rainfall in Alberta on both Barley yields and Wheat yields over the years, that is an increase in rainfall generally leads to an increase in both crops’ yields yield and vice versa.
Correlation (log wheat, average rainfall) =0.5161
Correlation (log barley, average rainfall) =0.600
MEAN TEMPERATURE, MEAN MINIMUM AND MEAN MAXIMUM TEMPERATURE
All crops have minimum, optimum and maximum temperatures at which growth processes are affected, called cardinal temperatures. For example, minimum temperatures are needed for plant processes such as germination, vegetative growth, root growth, water uptake, photosynthesis, respiration, flowering and for seed development to take place. Temperatures below the minimum will stop plant processes. At optimum temperature, plant processes proceed at an optimum rate and above a maximum temperature, plant processes stop.
Heat stress and water stress commonly occur in the southern Prairies, however they also occur periodically across all agricultural regions. They can occur separately or simultaneously. Water stressed plants do not have adequate soil moisture to meet transpiration needs, causing stomata to close, which, in turn, results in an increase in plant temperature.
The upper temperature for heat stress varies with crop type and growth stage development. For wheat, the typical optimum temperature range for photosynthesis is between 15 and 30 C. Heat stress increases when temperatures are between 30 and 40 C; above 40 C, the photosynthetic processes can permanently break down. High temperature can affect various growth stages. For example, yield of wheat is impacted when high temperatures occur five to 10 days before anthesis, when pollen is formed and viability can be seriously affected.
Low temperature or chilling stress can occur when plants are exposed to a low temperature above 0 C. Freezing stress occurs when plants are exposed to a low temperature below 0 C and can seriously affect crop growth and yield. Plants that have experienced periods of low temperatures before a frost are able to tolerate lower temperatures than those without a hardening off period. For example, wheat and canola at the seedling stage that have been hardened to low temperatures can often survive temperatures down to – 6 C.
In relation to the data I collected, below I provide a Two-way scatter plot with a line of best fit of Log Barley and Log wheat in the Y-axis and Average Temperature in the x-axis
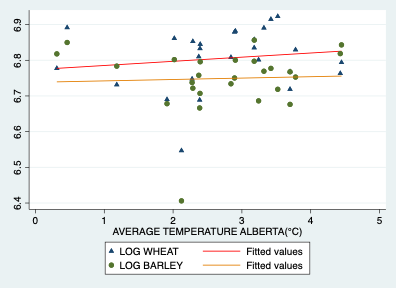
Correlation (Log wheat, Average temperature) =0.1434
Correlation (Log barley, Average temperature)=0.0460
There is quite a weak correlation between both Log wheat and log barley with Average temperature in Alberta over the years 1980-2005.
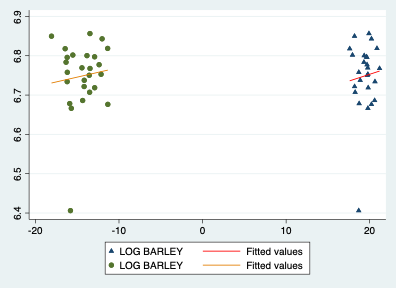
In relation to the data I collected, below I provide a Two-way scatter plot with a line of best fit of Log wheat in the Y-axis with mean extra minimum Temperature and mean extra maximum Temperature in the x-axis
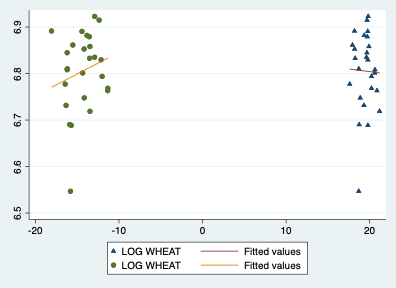
On the right of the graph, we have a scatter plot between Log wheat and mean extra max temperature a variable in my regression. On the left is scatter plot between log wheat and mean extra min temperature.
Correlation (log wheat,mean extra max temp)= -0.0246
Correlation(log wheat,mean extra min temp)=0.1971
In relation to the data I collected, below I provide a Two-way scatter plot with a line of best fit of Log Barley in the Y-axis with mean extra minimum Temperature and mean extra maximum Temperature in the x-axis
On the right of the graph, we have a scatter plot between Log barley and mean extra max temperature a variable in my regression. On the left is scatter plot between log barley and mean extra min temperature.
Correlation (log barley, mean extra max temp) = 0.0738
Correlation (log barley, mean extra min temp)=0.0984
They both have a weak positive correlation, meaning an increase in mean extra max temp will cause a little increase in barley yields, and an increase in mean extra min temp causes a little increase in barley yields.
MEAN SNOW
Too much or too little of anything can be bad. The same is true of snow in the landscape. Snow can be beneficial to landscape plants. Its acts as an insulator and can protect some plants from the effects of freezing and thawing and provides moisture as is melts. On the downside, too much snow can put added weight and cause damage to plant structures and in waterlogged areas it can make things even more soggy and damage root systems. In the Southeast much of the damage we see when it snows is from ice that is a result of our repeated freezing and thawing. This repeated freezing and thawing can cause plants to heave out of the soil as well as damage susceptible flower buds.
- Moisture. Obviously, snow brings much-needed moisture to wheat fields. The general rule is 10 inches of snow equals 1 inch of rain, although this varies, depending on how fluffy or heavy the snow is. One of the benefits of getting moisture in the form of snow is that nearly all the moisture will move down into the soil and remain there for quite some time. Since the weather is cold, or at least cool, after a snow, very little of it will evaporate immediately.
- Root development. Moisture from snow will help increase root growth of wheat. Even if the top growth is dormant and isn’t growing during periods of cold weather, roots will continue to grow if there is moisture.
- Soil protection. Snow cover does a great job in keeping the soil from blowing. As long as the ground is protected by snow, soil particles on the surface can’t be picked up by high winds, thus preventing wind erosion for a time.
- Soil temperatures. Snow has an insulating effect on the soil, keeping very cold air temperatures from reducing soil temperatures and protecting the crown of the wheat plant from cold injury. Snow also keeps soils warmer during the winter by adding moisture to the soil. It takes much longer for wet soils to get cold than dry soils
In relation to the data I collected, below I provide a Two-way scatter plot with a line of best fit of Log Barley and Log wheat in the Y-axis and Average snow in the x-axis.
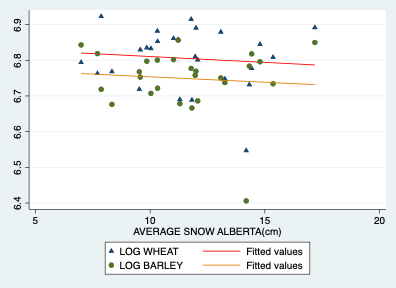
The red line represents the fitted values for the scatter plot of Log wheat with respect to mean snow in cm.
The orange line represents the fitted values for the scatter plot of log barley with respect to mean snow in cm.
Correlation (log wheat, average snow) = -0.00989
Correlation (log barley, average snow) = -0.0875
Negative correlation meaning as snow increases, we have a fall in both barley and wheat yields, even though the effect is higher on wheat.
With this in mind, our goal in this paper is to analyse the effects of climate change specifically on crop yields in Alberta (Canada), between the years 1980-2005 respectively. The specific crops we will be looking at are wheat and Barley.
METHODOLOGY OF RESEARCH
In order to see the bigger picture, we will first bring a discussion on how and where the information for the analysis was collected.
All the crucial raw data was collected from Stats Canada.
With the help of 27 weather stations found in aLBERTA, I was able to collect monthly weather readings of Temperature, snow and rainfall for the years 1980 to 2007.
The data was then compiled and cleaned to get rid of blank spaces and abnormal data.
Finally, for each stations weather record readings I calculated the mean yearly Variables I was going to use in my regression with the use of some excel formulae.
The information on the Wheat and Barley yields in Alberta was obtained from Stats Canada, this data need not be modified as it was exactly what was needed. The crop values in tonnes for the specific years were collected.
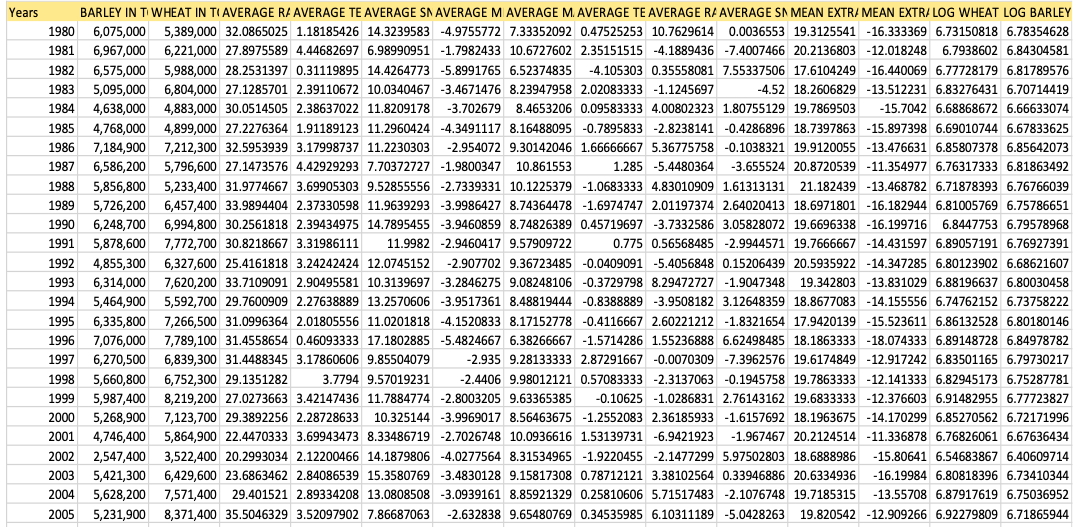
Finally, I merged the two Tables to obtain one final table.
The final table portraying the data is seen below,
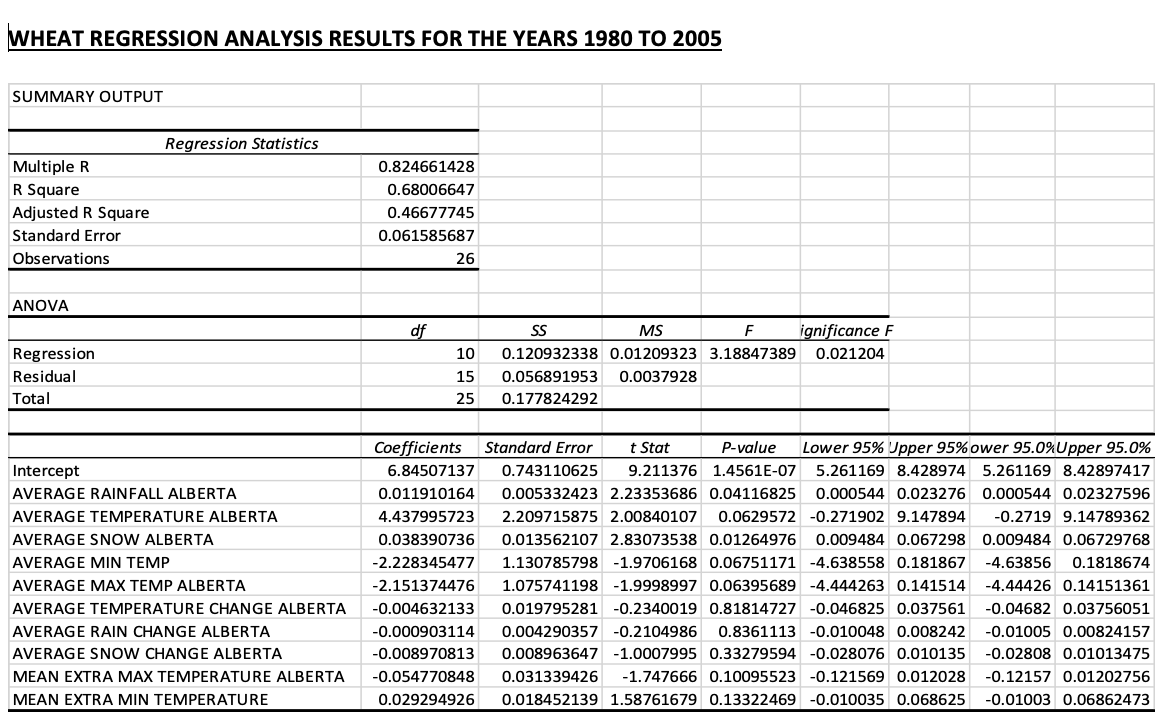
WHEAT REGRESSION ANALYSIS RESULTS FOR THE YEARS 1980 TO 2005
RESULTS ANALYSIS
To start with, there are 10 variables in my regression, for 26 observations.
The variables affect the Log (Wheat yields) differently, some have a positive effect on the wheat yield others have a negative effect on the wheat yield. Which is seen by their coefficients, which describes how the independent variables affect the dependent variable.
In the regression AVERAGE RAINFALL and AVERAGE SNOW variables are significant with a P-value less than 0.05, those with a P-value higher than 0.05 are not significant.
The multiple linear regression explains about 46.677745% of the total variability, which is shown by the adjusted R-squared.
My regression significance is 0.021204, this is less than 0.05 therefore my regression is significant.
So, we can conclude that Climate change has an impact on Wheat yields in Alberta.
INTERPRETATION OF RESULTS WITH RESPECT TO MY RESEARCH
The coefficients of the regression in my results describe the marginal effects of the independent variables on the Barley yields in my log linear regression.
In this section we will use only the coefficients to see how the independent variables affect the wheat yields.
AVERAGE RAIN CHANGE has a coefficient of about -0.0903%, this implies that a change of about 4 millimetres in rainfall will cause a fall in wheat yields by about -0.3612%= (4*-0.0903%) but this effect is non-significant, so we are not certain.
AVERAGE TEMPERATURE CHANGE has a coefficient of about -0.463%, this implies that a change of about 4 degrees in Temperature will cause a fall in wheat yields by about -1.852%=4*-0.463%, but this effect is not significant.
AVERAGE SNOW CHANGE: A change of about 10cm in snow will cause a fall in wheat yields by – 8.971% =10*-0.8971 but this effect is not significant.
The same reasoning line can be applied on all the other variables to identify their marginal effects.
BARLEY REGRESSION ANALYSIS FOR THE YEARS 1980 T0 2005
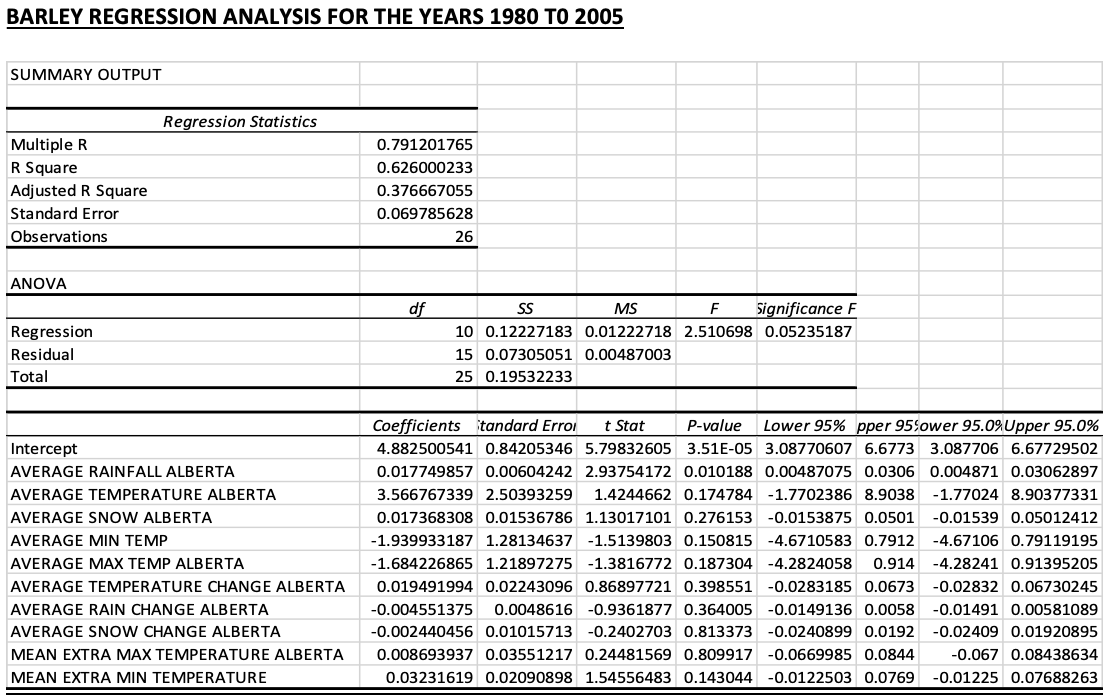
RESULTS ANALYSIS
To start with, there are 10 variables in my regression, for 26 observations
Based on the coefficients values, we see that some variables have a negative effect on log (Barley) while others got a positive effect on log (Barley).
Unlike with wheat we see that there is only one significant variable in this regression which is AVERAGE RAINFALL.
The Multiple linear regression explains about 38% of the total variability, which is show by the adjusted R-squared.
My regression has a degree of significance of 0.05235187, this is greater than 0.05 so I can conclude that my regression is not significant. Being close enough to 0.05 I suppose including more variables like windspeed from 1980-2005, average humidity index/level etc. will help make my regression significant. Thereby confirming that climate change actually has an impact on the Barley yields in Alberta.
INTERPRETATION OF RESULTS WITH RESPECT TO MY RESEARCH
The coefficients of the regression in my results describe the marginal effects of the independent variables on the Barley yields in my log linear regression.
In this section we will use only the coefficients to see how the independent variables affect the Barley yields.
AVERAGE RAIN CHANGE has a coefficient of about -0.45%, this implies that a change of about 4 millimetres in rainfall will cause a fall in Barley yields by about -1.8%= (4*-0.45%) but this effect is non-significant, so we are not certain.
AVERAGE TEMPERATURE CHANGE has a coefficient of about 1.95%, this implies that a change of about 4 degrees in Temperature will cause an increase in Barley yields by about 7.8%=4*1.95%, but this effect is not significant.
AVERAGE SNOW CHANGE: A change of about 10cm in snow will cause a fall in Barley yields by – 2.44% =10*-2.44 but this effect is not significant.
The same reasoning line can be applied on all the other variables to identify their marginal effects.
Conclusion
With the data I have used, I was able to obtain a significant analysis result with Wheat but with Barley my regression was not significant. This helps us observe that these are different crops and are actually affected differently by climate change, it helps us understand that some crops are actually more resistant to climate change than others, and some may not really be affected by climate.
Data source for stations data:https://climate.weather.gc.ca/historical_data/search_historic_data_e.html
Data sources for wheat and barley yields:https://www150.statcan.gc.ca/t1/tbl1/en/tv.action?pid=3210007701&cubeTimeFrame.startMonth=04&cubeTimeFrame.startYear=2013&cubeTimeFrame.endMonth=08&cubeTimeFrame.endYear=2021&referencePeriods=20130401%2C20210801
Publishers: 🙁https://www.jstor.org/stable/pdf/3552453.pdf?refreqid=excelsior%3Ae08b1b5a55181a50ee17869d7b33d472)
(MARIAN WEBER, Alberta Research Council Edmonton, Albert).
A report: https://www.cbc.ca/news/science/climate-change-farming-1.5461275