
There’s a great deal of open data available on the GoC Open Data Portal. To have some fun, I’ve decided to randomly select datasets from the portal and explore what can be learned from these datasets using some quick analysis techniques. This blog post represents my first foray into this dataset adventure!
The open data portal doesn’t have a random button, but random.org guided me through the site choices and I ultimately ended up taking the following path:
Luckily, once I landed on this page, there was enough documentation and metadata provided to help me determine that the Protection within the Communication System Quantitative Research Report (PCSQR) dataset tells us something about how Canadians feel about the The Canadian Radio-television and Telecommunications Commission’s ability to protect Canada’s communication systems. In a nutshell, they asked Canadians a small number of questions relating to this topic first in 2015 and then again in 2017. The PCSQR dataset has data from both years, so a comparison is possible.
The dataset also has information about the sample itself – e.g. how many people refused to respond to the questionnaire. But let’s tackle the main data first.
Canadians were asked the following questions:
Q1.The Canadian Radio-television and Telecommunications Commission or CRTC is an independent agency of the Government of Canada, responsible for regulating Canada’s communication system. As part of that role, the CRTC ensures that the communication system enhances the safety and protection of Canadians. Would you say that you feel you are very well informed, well informed, not very well informed or not informed about the mandate and role of the CRTC of ensuring Canadians’ safety and protection in the communication system?
Q2. Would you say that you strongly agree, somewhat agree, somewhat disagree or strongly disagree that the CRTC is taking measures to enhance the safety and protection of Canadians in the communication system?
Q3. If I told you that the CRTC carries out activities related to: accessing 9-1-1 services, warnings of emergencies on TV and radio, Canada’s anti-spam legislation, protection against unwanted or telemarketing calls, a code of conduct for wireless service providers, and protection against misleading calls during federal elections. Would you say that you strongly agree, somewhat agree, somewhat disagree or strongly disagree that the CRTC is taking measures to enhance the safety and protection of Canadians in the communication system?
Q4. Now some questions about telephone calls you might receive that sell or promote a product or service, also known as telemarketing calls. About how often would you say that you personally receive these types of telephone calls?
Q5. As far as you know, are there currently any products or services available to help you block these types of calls?
For each question, respondents were asked to select a level from a Likert item.
The raw respondent data are not provided in the dataset – rather, two different types of aggregate data are provided. First, the percentage of all respondents for each level of each Likert item are provided. As well, the percentage of respondents who responded at or above a certain level are provided for each of four country regions, each of three age groups, each of two genders and each of three education levels.
There’s already a lot of information here! Since I wanted this to be a relatively quick exploration, I decided to zoom in on one question and one subgrouping – Question 5 and age level.
Before I graph this, though, I want to add an important caveat. In the documentation, it is noted that the results have been weighted based on census data. What does this mean? Essentially, if the percentage of people in each category of the survey data did not match the percentage of people in the census data, the responses were given a weight to make sure that the categories were represented proportionately in the final result.
The documentation also provides us with margin of error information, but only for the entire sample, and notes that the error margin will be larger for subpopulations. This means that we don’t actually know what the margin of error will be, but we do know that it will be larger than +/- 3.1 percentage points, in 19 out of 20 samples.
At long last, I loaded the chosen data into R and produced a graph!
Here’s the code with each step broken out so it’s a bit easier to follow:
CRTCdsq5 <- read.csv("Q5.csv")

CRTCdsq5ages <- CRTCdsq5[6:8,]

rownames(CRTCdsq5ages) <- CRTCdsq5ages[,1]

CRTCdsq5ages <- CRTCdsq5ages[,-1]

colnames(CRTCdsq5ages) <- c("Yes","No","Don't_know")

barplot(as.matrix(CRTCdsq5ages), legend = rownames(CRTCdsq5ages), beside=TRUE, ylim=c(0, 1))
This gives us a very basic visualization of the data (which I may return to in a later blog post to deal with the error bar issue and a few other notes).
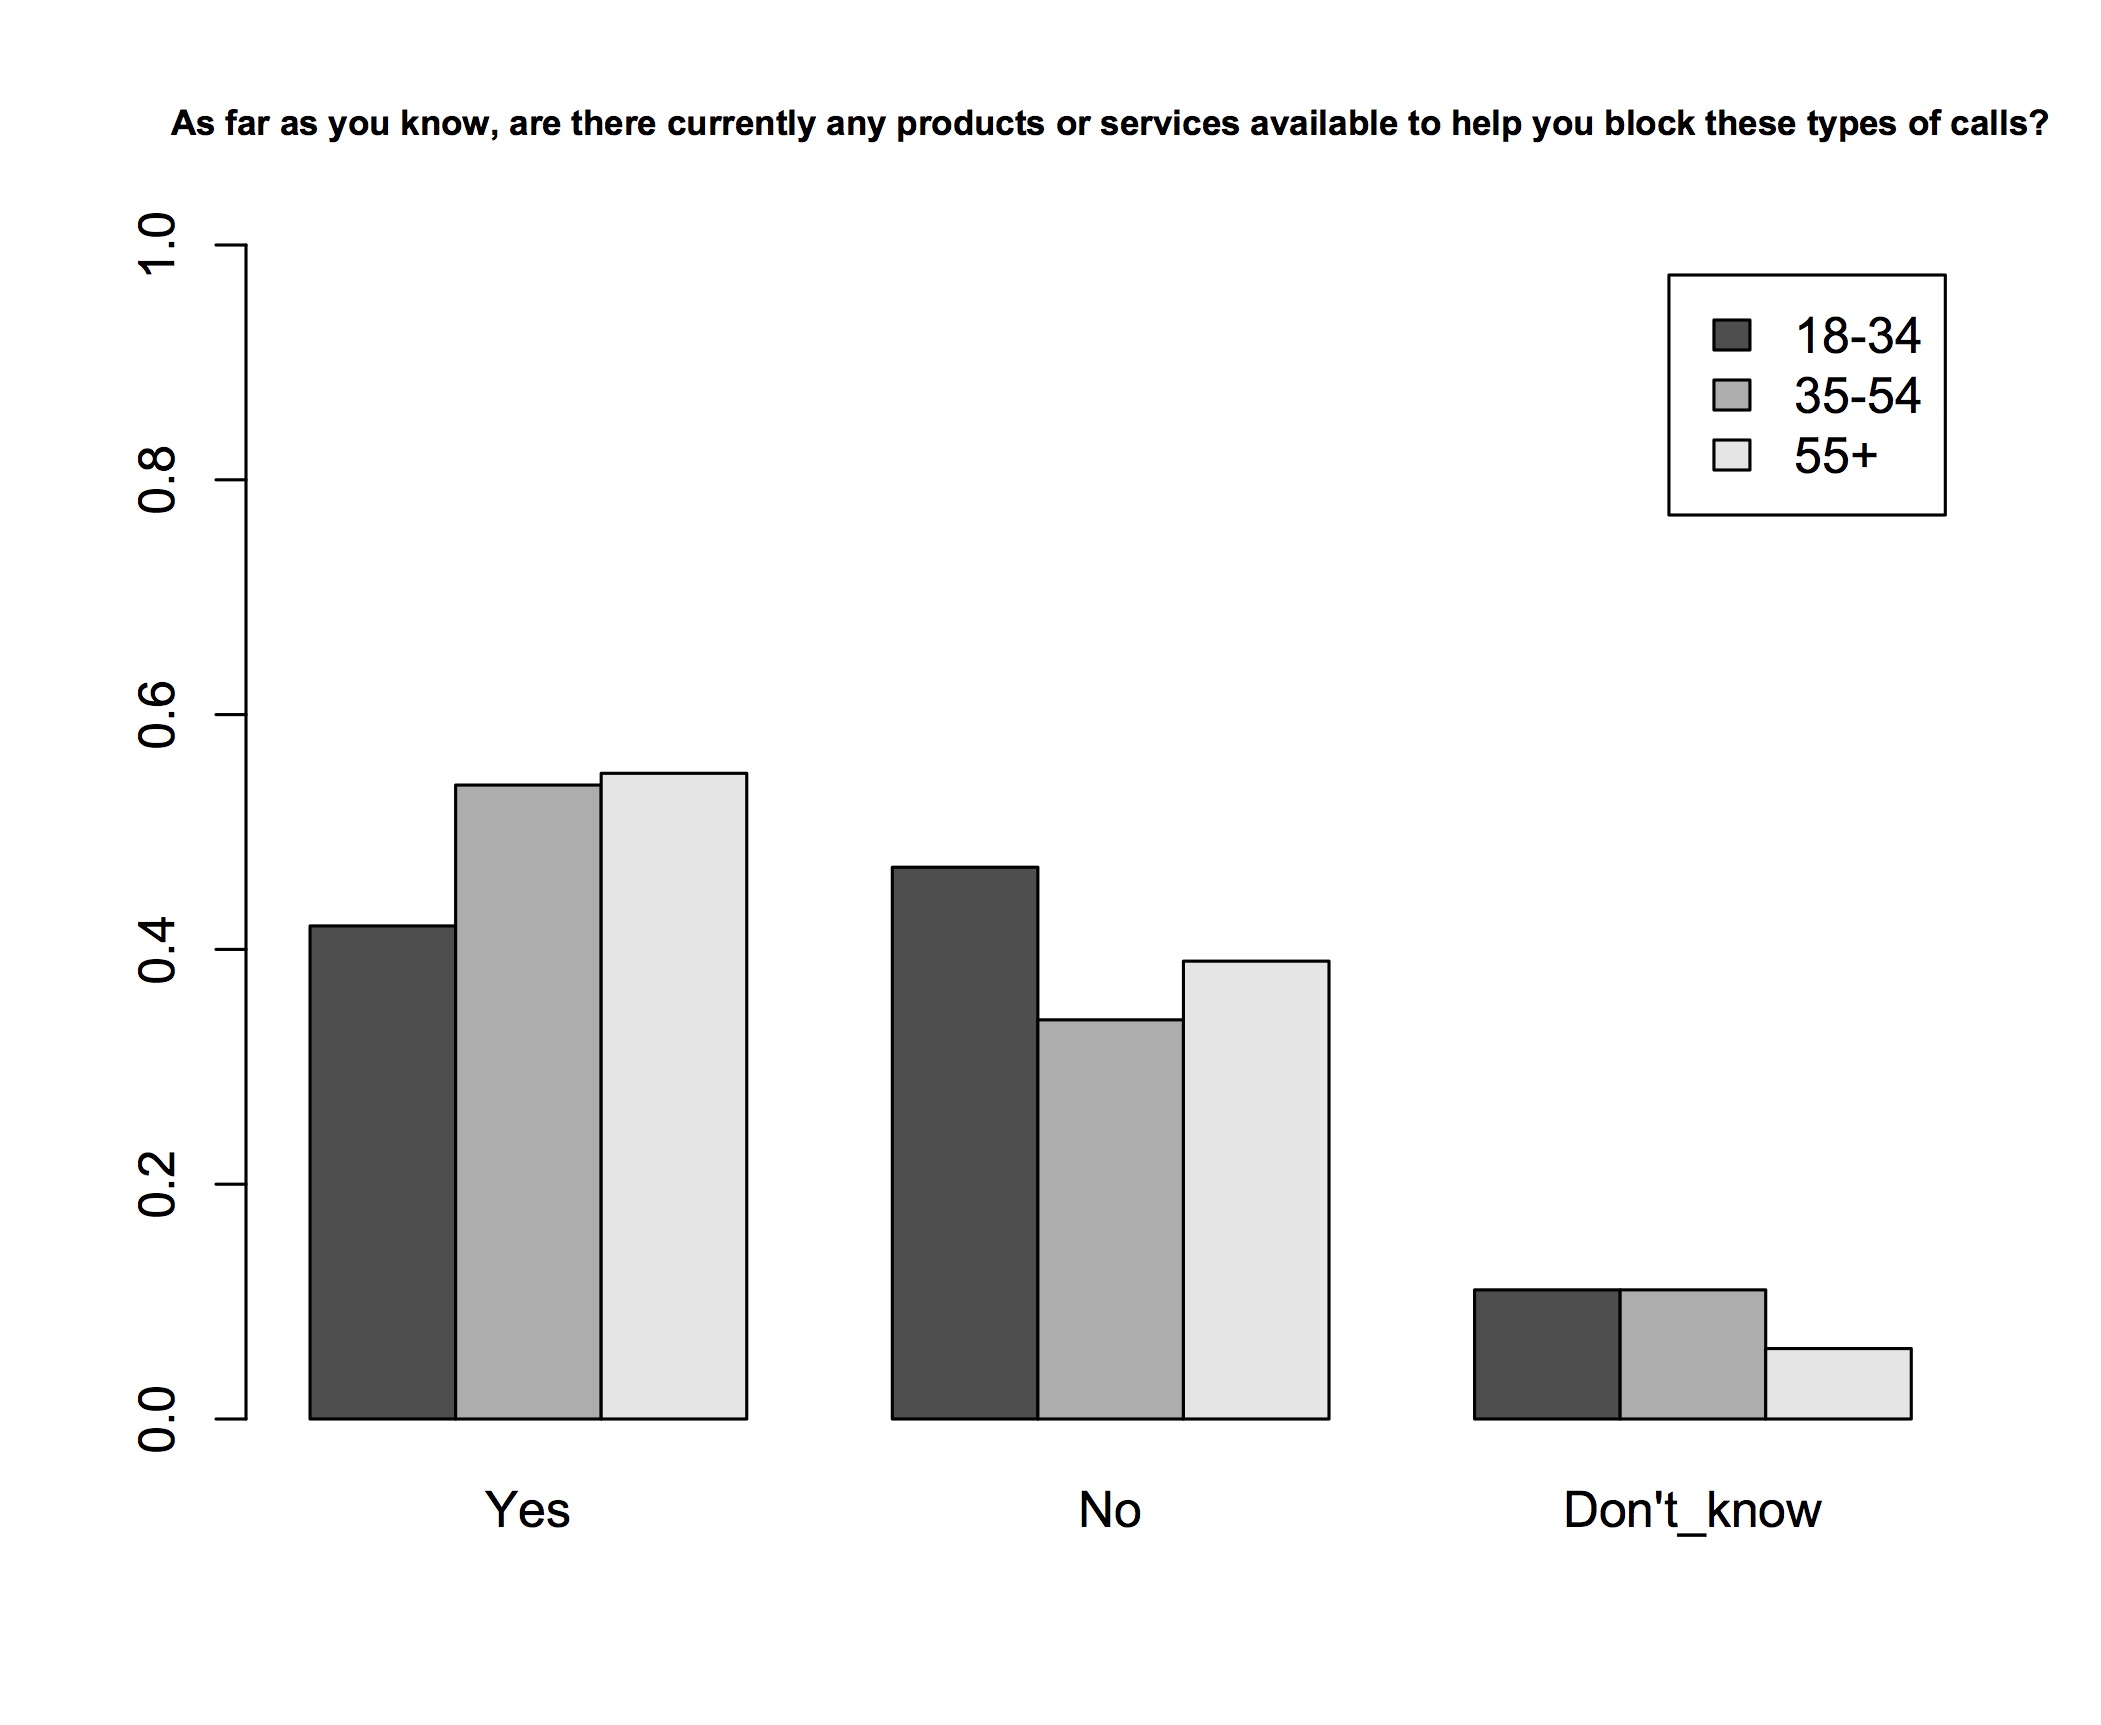
What I find interesting about this is the interpretation. CRTC does in fact run a service to block telemarketers. This is important because it means that the people who said ‘yes’ are also the people who are correct. Here it’s interesting to see that young people are slightly more confident that there are no services to help block this type of call – and also that the gap (8% relatively to next highest percentage) is, perhaps, large enough to be statistically significant.
I’m sure there are many more insights to be gathered from this dataset, but I’ll leave it there for now, and look forward to exploring another random dataset in the near future!