

by Josh Larock

Statistical quality control, the use of statistical methods in the monitoring and maintaining of the quality of products and services. One method, referred to as acceptance sampling, can be used when a decision must be made to accept or reject a group of parts or items based on the quality found in a sample. A second method, referred to as statistical process control, uses graphical displays known as control charts to determine whether a process should be continued or should be adjusted to achieve the desired quality.
– Encyclopedia Britannica
This blog post is aimed at helping you begin thinking of ways to apply statistical quality control to your business or side hustle. You do not need a background in math or statistics to get value from this post or begin understanding these ideas. In fact, numbers are only used for the business examples. You will first learn about acceptance sampling and how it can be used to check the quality of your shipments. Then, you will see how statistical process control can be used to create monitoring systems which alert you whenever there is a change in quality. If you want to get into the nitty-gritty of these topics, there are many technical guides available on the web.
Table of Contents
Acceptance Sampling
Depending on the industry, acceptance sampling may be a useful tool for your business to ensure that your shipments stay within your own quality standards.
Important Definitions
While many of the concepts below are intuitive, knowing the terminology used by practitioners will make it easier for you to communicate with them during future projects.
Lots and Lot Size
“Lots” are collections of items, such as shipments or packages, that need to be tested to maintain a desired level of quality. The lot size is the number of items in the lot.
Acceptance Quality Limit (AQL)
The AQL is the maximal percentage of defective items you would be willing to allow before rejecting the lot. With an AQL of 1, lots would be accepted as long as no more than one out of every 100 items is defective; any lot with a higher percentage of defective items would be rejected. While it would be impossible to guarantee the limit is never exceeded from viewing only a sample of the lot, this value can be used to decide which lots you accept and reject using statistics.
Sampling Plan
A sampling plan is the strategy that will be used to determine wether or not a lot will be rejected. The choice of sampling plan would depend on the type of lots, the lot size and acceptance quality limit. A sampling plan can be as simple as selecting ten items from a lot, counting the number of defective items of those ten, and then determining using statistics wether the percentage of defective units likely exceeds the AQL or not. Sampling plans can also become more complex depending on what type of problem acceptance sampling is being applied to.
Consumer and Producer Risks
Consumer and producer risks are the acceptance sampling terms for false positives and false negatives. The consumer risk is the percentage of lots that exceeded the AQL but were misclassified by the sampling plan, leading to those low quality lots being shipped anyways. The producer risk is the percentage of acceptable lots that the sampling plan wrongly rejected despite being within the AQL.
Operating Characteristic (OC) Curves
An OC curve is a way of visualizing through simulation the performance of a sampling plan in a given situation. It is used to compare different percentages of true defective rates a lot with the probability that the sampling plan accepts the lot. If it were possible to have perfect sampling plan, you would see an OC curve would remain at one for all percentages under or equal to the AQL, and then fall to 0 for anything above the AQL.
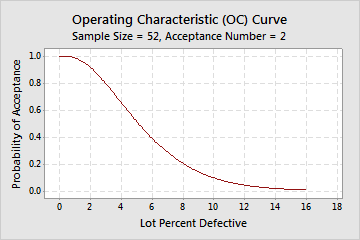
Above is a picture of a common OC curve on the Minitab (a statistical software) website [3]. If the AQL was set at 2%, you can see by the curve that even when 4% of the lot is defective, the probability of accepting the lot is still high. This implies that there is high consumer risk. A different sampling plan should be considered that would produce a better OC curve.
Small Business Example
A small local bakery bakes and delivers large orders of 500 muffins every week to the breakfast club of a nearby elementary school. While the muffins typically have the same shape and size, occasionally there is one that is misshaped. The bakery does not have the resources to check every muffin to guarantee good quality of these deliveries and still manage the day to day operations. The business could use acceptance sampling to help maintain the quality of the orders without needing to spend as much time. The baker randomly inspects 25 muffins carefully. Based on the findings of the acceptance sampling, the owner can avoid shipping poor quality muffins to the school.
While the bakery example involved items that were were produced by hand, in situations where machines are mass producing these items, acceptance sampling may be unnecessary. If it is possible to collect real-time data on the outputs, statistical process control can be used to create a monitoring system that alerts the user when the number of defective units being produced begins to increase.
Statistical Process Control
Statistical process control (SPC) has been a standard tool for almost a century in industrial and manufacturing contexts. With the explosion of data that has become available and the innovative new methods created, SPC is now finding a home in many industries. For instance, SPC-based monitoring systems are used by hospitals to improve healthcare quality [1] and by environmental scientists to monitor pollution levels [2]. The remainder of this post will provide you with a high-level introduction of the topic, with the aim of helping you get a sense of where your own business could benefit from SPC through examples and questions.
Key Concepts of SPC
To be able to think of ways of helping your business with SPC, a few key concepts need to be covered beforehand.
Process
In SPC, a process is a small part of a system that continually reoccurs throughout time. In a business context, this could be anything from orders or deliveries to work hours or social media responses.
Common Causes of Variation
Common causes of variation from another part of the system have a predictable impact on the process of interest. For instance, the time of year would be a common cause for ice cream sales.
In Control
A process is in control when, once you remove the common causes of variation from the data, the data is stable over time — if you watched the process for a while, you will end up with a good idea of what is in store if the process stays in control.
Out of Control
A process that was previously in control but has now experienced a change is said to be out of control. For example, if the AC in the office breaks, the once in-control room temperature process becomes out of control.
Control Chart
Control charts are modern tools of quality and process control. Process charts show data being collected over time and identify when the process goes out of control.
Control charts have a long history; the first one was made by Walter A. Shewhart in the 1920s. To this day, data and engineering professionals still develop modern control charts to solve new problems.
Control Limits
Simply put, control limits are how a control chart detects when a process goes out of control. This can be chosen arbitrarily, but are typically based on statistical tests. A good control limit would give a signal as little as possible when the process is in control, but would detect an out of control process quickly. This idea is formalized by the average run length (ARL), where a run is how long it takes for the control limit to be reached. We would want a long ARL when a process is under control and a short ARL when the process is out of control. If you are monitoring your firm’s billable hours and typically bill between 150 and 200 hours a week, a lower control limit might be 100, meaning you are not billing enough to make payroll. An upper limit might be 300 hours, which man be important to reduce the risk of burnout.
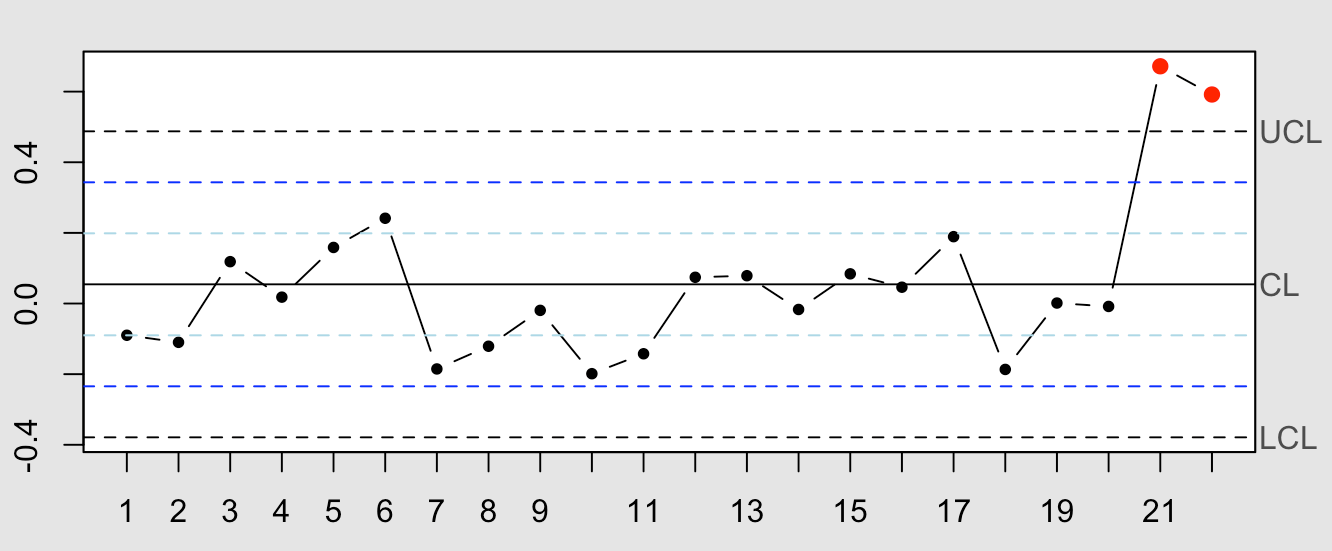
Above is an image of a simple type of control chart after common causes of variation have been removed. The black dots show an in control process through time, while the red dots on the right of the chart show where the process went out of control. The top and bottom black dotted lines are the control limits. This was created with the “qqc” package for the R programming language.
Monitoring System Examples in Small Businesses
Below are just four of the possible benefits that can come from using SPC-based monitoring systems in your business.
- Reduce the number of defects in production
- Improve client satisfaction through maintaining high quality output
- Increase productivity and efficiency by quickly identifying when the process is not running smoothly
- Decrease the need to inspect a process manually, which in turn frees up company resources
Here are some fictional examples illustrating how you could apply SPC to your business.
Production
You are looking to monitor the number of defective items in their production process. Currently, for every 100 items your machine produces, on average 3 are defective. At the end of each production day, a sample from the 5 of the new items is taken and the defective ones are counted. A SPC-based monitoring system can send an alert if it seems that defective units are being created significantly more often than usual, hinting at a problem with the machine. A quick alert may be the difference between fixing the machine quickly or falling behind on your orders.
Website Traffic
If you usually have 30 unique website visitors a day and a monitoring system for the unique visitors of your company website, an alert of getting no visitors might be a sign there might be a problem with the website. On the other hand, an alert saying you are getting 100 visitors could be a sign that your business was mentioned in the media or that someone is trying to hack you. Being alerted as soon as possible of this change will allow you to deal with the issue sooner, getting the process and business back in control sooner.
Customer Support
You know great customer service is important, so much so that you spend a lot of time monitoring their emails. In an attempt to regain your time and focus without lowering your standards for support, you could implement a monitoring system for the wait times of an email response. If your customers typically experience a wait time of 2-3 hours, a monitoring system would alert if responses were starting to take 4 hours. Then you could spend less time checking emails without risking your customers being left too long without an answer.
Conversion Rates
Conversion rates, which tell you what percentage of website visitors that end up making it to a certain stage of the customer journey, are key metrics for any online business. Monitoring these rates over time can help you identify problems in your online funnel quickly. This in turn can allow your business to make the necessary changes to leave less money on the table. If when in control, you typically have a conversion rate of 3%, a drop to 2% makes a big difference. A control limit would be able to detect this drop as it happens, and send you an alert.
Probing Questions
Like all tools, SPC works well for some problems but would not work in others. To begin thinking of areas in your business that could be improved through SPC based monitoring systems, you can start by asking yourself the questions listed below.
Is this process in control?
To implement SPC, the process must have a stable component that could be monitored for changes. Sometimes, this may be easy to spot if the process is not affected by outside influences. More often though, there are common causes. These patterns can be removed using quantitative methods, with what is remaining being in control.
Do I have or could I start collecting data on the process?
The monitoring system is built off a stream of data. There must therefore be a way of obtaining accurate data that describes the process and common causes of variation. If the data is not currently available, this must be addressed before any SPC can be implemented. Luckily, there are more ways of collecting data today than ever.
Is it important that the process stays in control?
The collected data and the control chart should lead to important information about a process being known quicker. Being able to answer this question is essential for setting control limits as well. If a specific process leads to a lot of damage when out of control, you want the alert to happen as soon as possible, even if it means more false alarms.
Is an alert from the monitoring system actionable?
Is there something that can be done once the control limit is reached to return the process to an in-control state? If this is out of your sphere of influence, then the alert will not be actionable, and the monitoring system may not be worth the effort of creating. If the alert gives you the opportunity to fix the issue immediately, the alert is valuable.
How much time is spent monitoring this process manually?
If no time is being spent on the process currently, then unless you feel that this is being neglected, there is no reason to monitor the process. On the other hand, if checking on a process is taking up a significant amount of time or causes stress, implementing SPC is likely to be a great investment. Small business owners work a lot, and knowing a monitoring system is in place will allow you to both physically and mentally step away from a process.
Conclusion
This blog post was meant to give you an overview of statistical quality control and provide a starting point for future brainstorming of places to apply it in your business. Acceptance sampling can be used to ensure a minimal quality of large shipments is maintained. For many types of businesses, statistical process control can be used to monitor different aspects of your business. These ideas can be an excellent standalone tool or as one part of a broader strategy for analytics. There are many subtleties to the field that require advanced knowledge. SPC practitioners stay up to date on different techniques can provide you with expert advice or build robust systems for you.