

by John Tsang
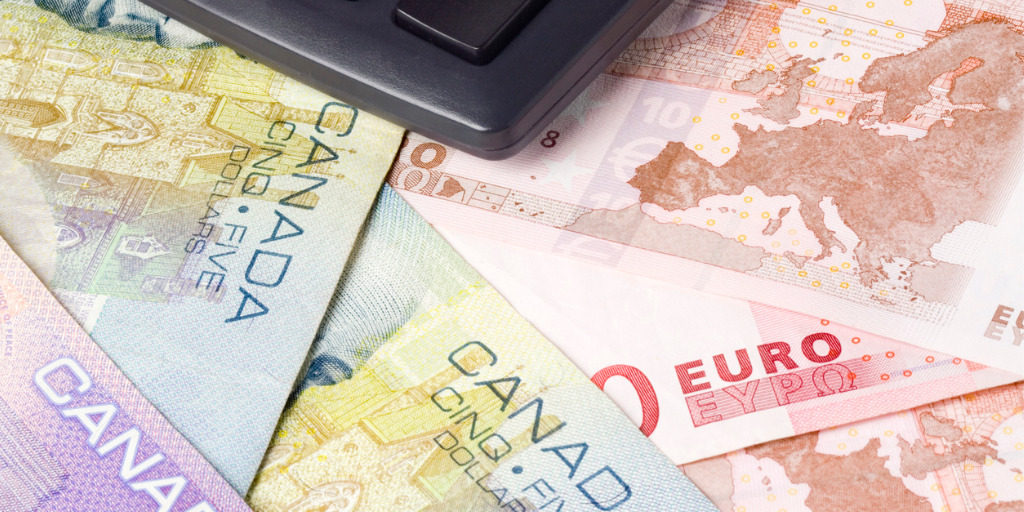
- the importance of CAD/EUR exchange rate to Canadians
- the comparison of the forecast accuracy, directional accuracy and profitability of five basic statistical models to predict the daily noon spot exchange rate between the Canadian dollar and the Euro (CAD/EUR)
- no single model can provide the best CAD/EUR forecasts in terms of the above three criteria at the same time.
- simple forecast combination methods (averaging and principal component regression) can bring significant improvement in profitability.
CAD Appreciation: Compared with the Euro, the CAD appreciates if CAD/EUR decreases. We need fewer CAD to get a Euro. So Canadians will enjoy cheaper goods from the EU, but Europeans will need to pay more for Canadian goods. In this situation, if you travel to the EU, every CAD you have is worth more.
Indeed, the EU is one of the largest trading partners with Canada, so the CAD/EUR exchange rate affects our daily lives. In particular, the number of imported goods from the EU grows faster than the US (5.6% vs. 4.7%. per year during the 2009-2019 period.)[Source] Therefore, forecasting CAD/EUR helps individuals and businesses in Canada to plan ahead of their purchases and trips post-pandemic!
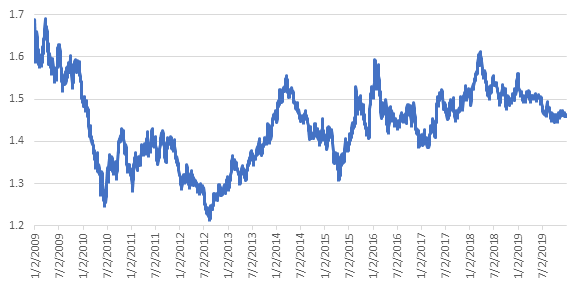
- Stylized Fact 1: The CAD/EUR exchange rate is relatively stable within a short time frame (say a month) most of the time. This stability comes from the small and open nature of the Canadian economy and the large and open nature of the European economy.
- Stylized Fact 2: There are no seasonal patterns in the CAD/EUR exchange rate.
I consider five basic statistical models to predict CAD/EUR in this article. Please refer to Wikipedia pages for more detailed explanation.
- The Random Walk (RW) Model: This model uses yesterday’s exchange rate to predict today’s rate. [Wikipedia Page]
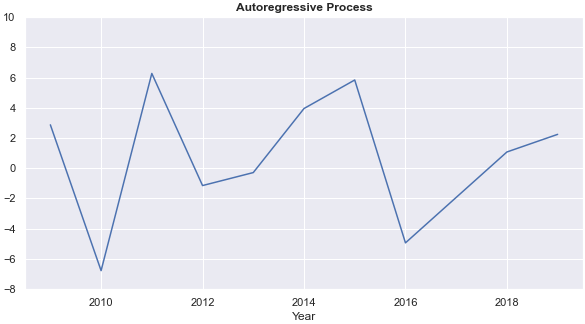
- The Auto-regressive (AR) Process: Compared with the random walk model, this model introduces the flexibility to allow for forecasts generated from a constant plus geometrically discounted previous CAD/EUR in terms of the distance from the current period. [Wikipedia Page]
- The k-nearest Neighbour (KNN) Regression: Forecasts from this model is the simple average exchange rates of the closest k observations. [Wikipedia Page]
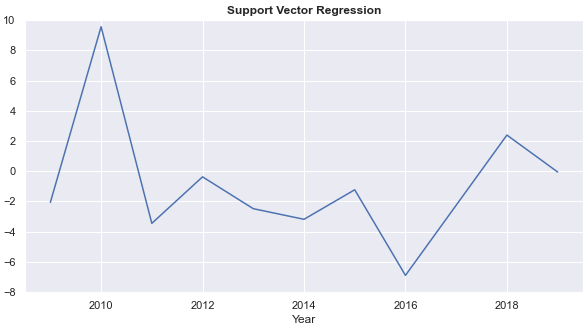
- The Support Vector Regression (SVR): This model only accounts for certain observations outside a band for prediction. [Wikipedia Page]
- The Decision Tree (DT) Regression: This model generates a forecast by checking if it fulfills a series of conditions. The same sequence of conditions gives the same prediction. Therefore, the decision tree imitates human decision-making. [Wikipedia Page]
All models above, except for the random walk and the auto-regressive process, have some parameters need to be selected before estimating each model. These parameters are called hyperparameters.
For simplicity, I do not consider predictors other than past CAD/EUR exchange rates (lags). This simplification is based on the efficient market hypothesis. I allow each model to use at most the past 14 days of the CAD/EUR noon spot exchange rates as predictors.
To predict the CAD/EUR exchange rate at time  ,
,
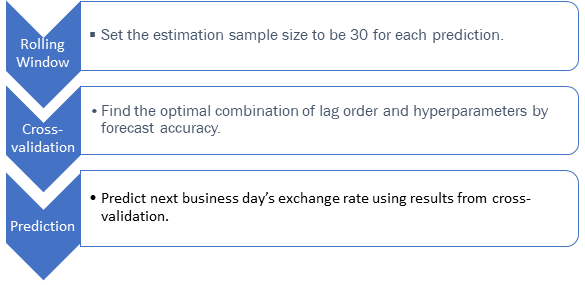
Step 1: Set up a rolling window consisting of 30 samples ( ,
,  , …,
, …,  ). These 30 samples will be used to estimate each base prediction model.
Step 2: Use cross validation to identify the optimal number of predictors (from 1 to 14) and the optimal hyperparameter for each base prediction model (if any).[1]
Step 3: Use the optimal specification found in Step 2 to predict the CAD/EUR exchange rate for the next business day.Exhibit 1 below summarizes the process to generate each forecast in this article.
I evaluate each forecasting model with three criteria:
- Forecast Accuracy
- Directional Accuracy
- Profitability
Each criterion is helpful for particular audiences.
I use the mean absolute percentage error (MAPE) to quantify forecast accuracy. The MAPE is the simple arithmetic average of the absolute value of the percentage deviation from the actual value. In other words, the MAPE averages the magnitudes of all prediction errors relative to the respective actual value. Mathematically, the MAPE for a model with n predictions is
![\[\text{MAPE}=\dfrac{1}{n}\sum_{t=1}^{n}\left\lvert\frac{\text{Predicted Value}_t-\text{Actual Value}_t}{\text{Actual Value}_t}\right\rvert.\]](https://www.data-action-lab.com/wp-content/ql-cache/quicklatex.com-8471270c0d0a4a53786e427ae13649db_l3.png "Rendered by QuickLaTeX.com")
The higher the MAPE, the less accurate the forecasting model is. Conversely, the lower the MAPE, the more accurate the forecasting model is.
Forecast accuracy captures the magnitude but not the direction of change. Therefore, it is more relevant to policymakers and central bankers who would like to maintain the stability of the exchange rate market. This measure is not as relevant to most people because most people cannot get this exchange rate when converting between the CAD and the EUR. Transaction costs charged by banks have a significant influence on the exchange rates most people get.
| Models | |||||
|---|---|---|---|---|---|
| AR | RW | KNN | SVR | DT | |
| 2009-2019 | 5 | 1 (Best) | 3 | 4 | 2 |
| 2009-2014 | 4 | 2 | 3 | 5 | 1 (Best) |
| 2014-2019 | 5 | 1 (Best) | 3 | 4 | 2 |
- The random walk model outperforms other models in terms of MAPE except for the 2009-2014 sub-period. During the 2009-2014 sub-period, the decision tree beats the random walk by only 0.006 percentage points.
- The out-performance of the random walk model is consistent with the Meese–Rogoff puzzle.
- The relative forecasting performance of the other three models is consistent throughout.
Directional accuracy is the relative frequency (in %) of correctly predicting the direction of changes in CAD/EUR. The higher the directional accuracy, the more accurate the prediction model is. Conversely, the lower the directional accuracy, the less accurate the model is.
Directional accuracy captures the direction of change but not the magnitude. It is more relevant to most people because the exchange rate from banks will go up as the exchange rate I consider in this blog article goes up.
| Models | |||||
|---|---|---|---|---|---|
| AR | RW | KNN | SVR | DT | |
| 2009-2019 | 3 | 4 | 5 | 1 (Best) | 2 |
| 2009-2014 | 1 (Best) | 5 | 2 | 3 | 4 |
| 2014-2019 | 4 | 3 | 5 | 2 | 1 (Best) |
- There are much more fluctuations in the forecasting performance than the forecast accuracy. For example, the auto-regressive process performs the best during the first sub-period. Still, it is the second-worst in the subsequent sub-period.
- The support vector regression’s out-performance comes from its relative performance stability and its better performance than half of the other models in each sub-period.
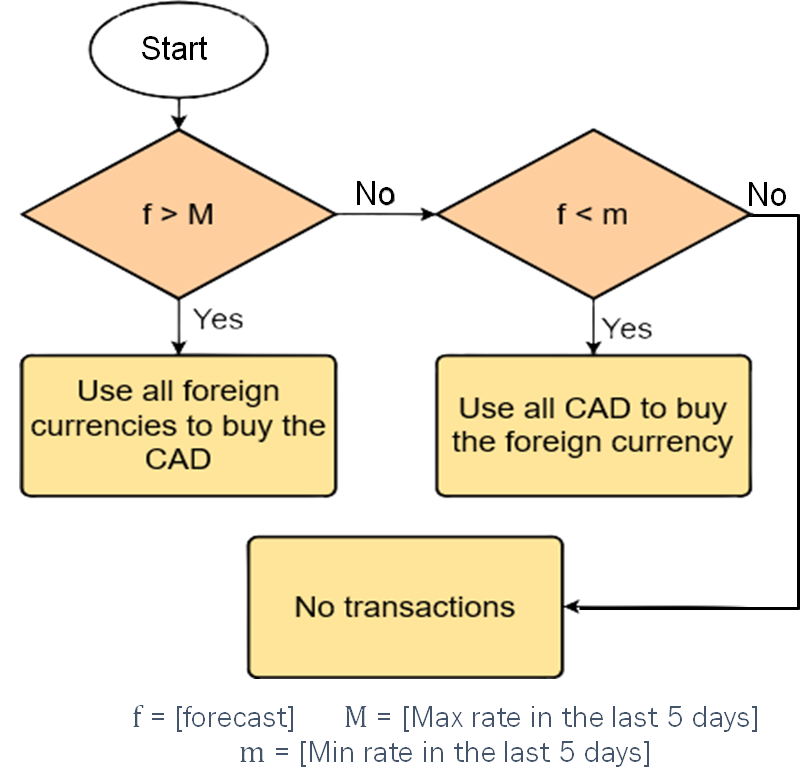
As discussed in Stylized Fact 1, most exchange rates are quite stable within a short time frame. I cannot include the random walk model for this evaluation because forecasts from this model will not trigger any transaction with this strategy.
Profitability captures both the magnitude and the direction of change at the same time. This measure is relevant to investors in the foreign exchange market.

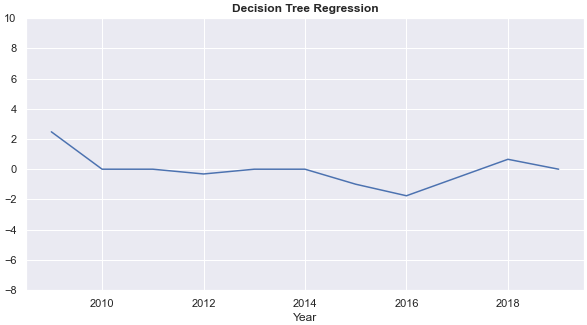
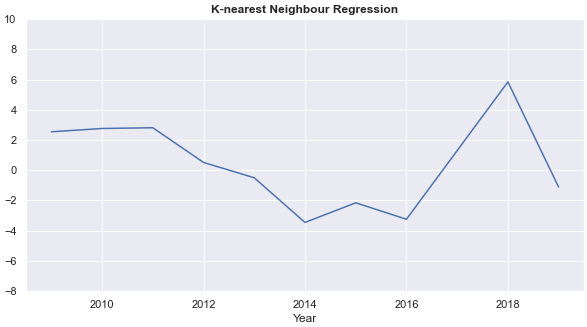
- Annual rates of return from each of the four models fluctuate each year. Annual returns from the k-nearest neighbour regression and the decision tree are relatively stable. The ARRs from the decision tree are 0 for five years, however.
- On average, the auto-regressive process has the highest annual rate of return.
This section highlights the improvement in profitability through averaging and principal component regression, showing the potential of more complex forecast combination methods to improve profitability.
As its name suggests, forecasts from averaging are the simple arithmetic average of all predictions from the four basic models (except for the random walk model.) The resultant average annual rate of return is higher than the auto-regressive process by 5 percent.
First, I find the first two principal components of predictions from the four basic models (except for the random walk model.) Then we run a regression with the two principal components as predictors to predict the next-day CAD/EUR exchange rate. This is the principal component regression (PCR.)
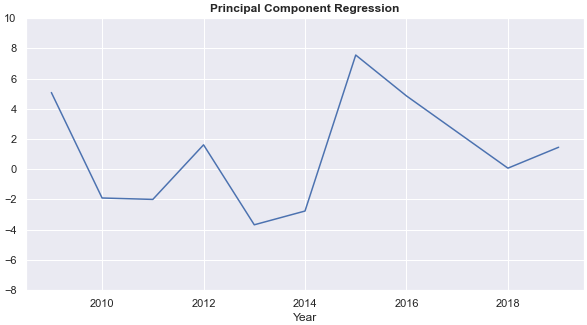
The PCR more than doubles the average annual return of the auto-regressive process and gives a more stable annual rate of return than the auto-regressive process. Chart 3 compares the annual rate of return from the auto-regressive process (AR) and the PCR.
- The random walk (RW) model has the highest forecast accuracy (MAPE), but it cannot outperform the four other models’ directional accuracy.
- The forecast and directional accuracy of models are not consistent with their profitability.
- The comparison cannot find evidence in any general approach to predict daily exchange rates. Practitioners should develop different models for different purposes.
- Forecast combination methods can significantly improve profitability, especially principal component regression. This improvement shows the potential of more complex forecast combination methods to improve profitability.
The next blog article will show how to use Python to carry out the above comparison and accelerate computational performance when estimating the models.
[1]: For each of the following models, I search for the hyperparameter that results in the lowest MAPE (grid search):
- The k-nearest neighbour (KNN) regression: the number k from 1 to 6
- The Support Vector Regression (SVR): the polynomial kernel with odd degrees from 1 to 9 inclusive
- The Decision Tree (DT): the maximum depth of the tree spans from 1 to 10