

by Ali Reghigh
Table of Contents
Deconstruction of program data
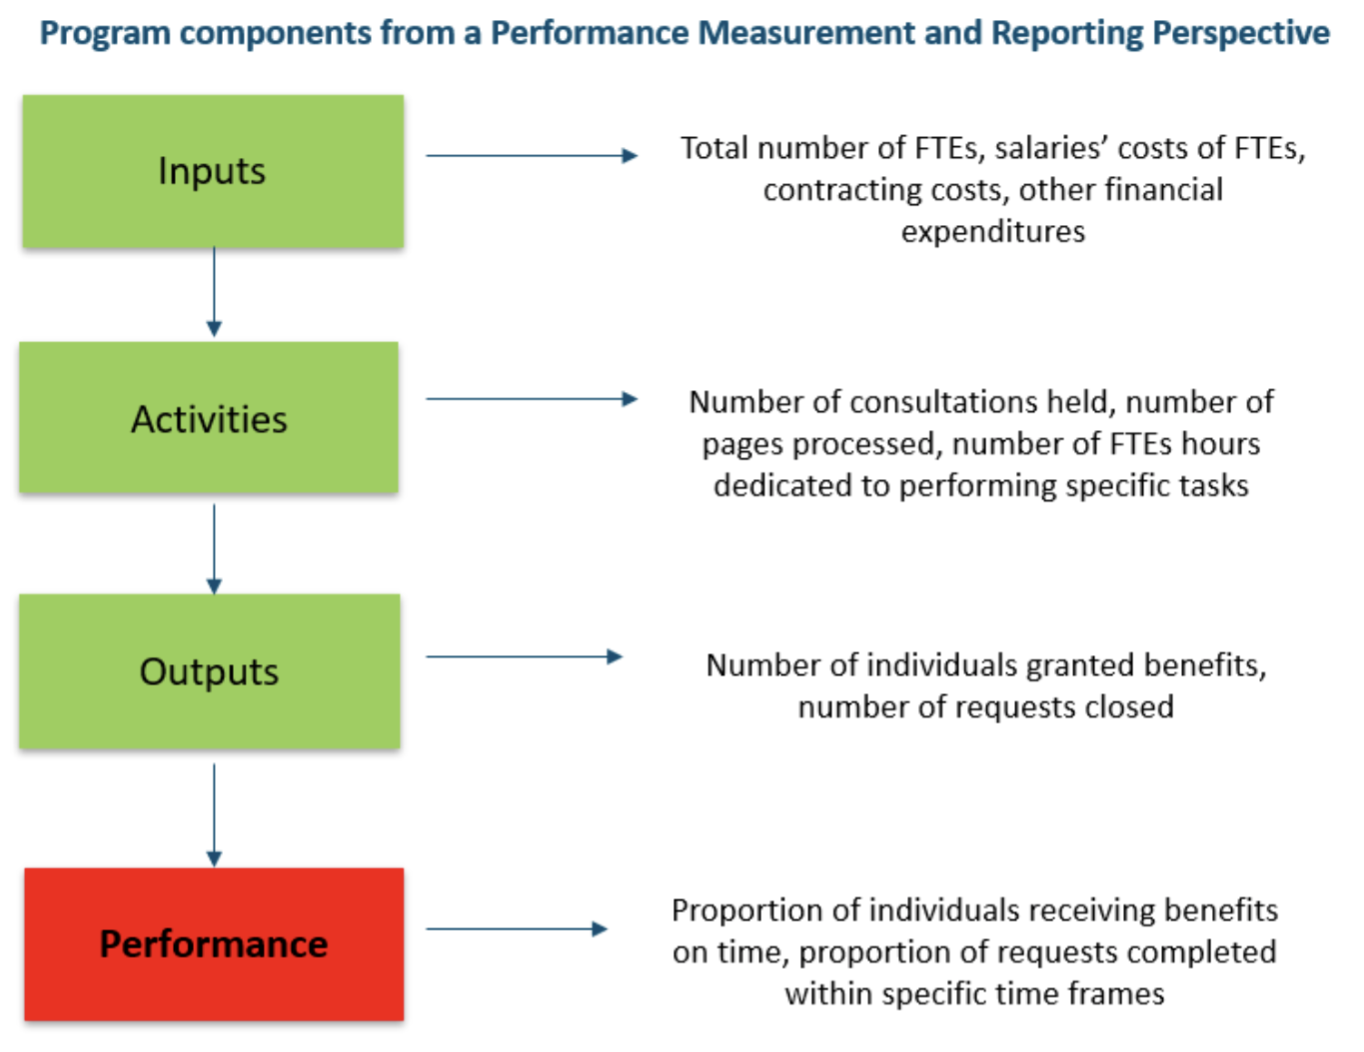
A program is an instituted set of funded activities that are undertaken with the intention of producing specific outcomes over time. For example, an employment insurance (EI) program consists of funded resources (e.g., public servants’ salaries and technology infrastructure) that are dedicated to performing activities, such as maintaining EI public web applications, reviewing EI claimants and granting EI benefits to qualified individuals.
Program data is a collection of raw measurements on the inputs, activities, outputs and performance of a particular program. In practice, such raw measurements are extracted from database systems linked to software applications within an organization. Program data may also be extracted from reporting applications that were created to capture and store program raw data for performance reporting purposes.
Using the EI program example constructed above, program inputs refer to the human resources and financial expenditures of a program, such as data on the total number of full-time equivalents (FTEs) and the total annual salaries of FTEs. The program activities refer to the tasks the program’s employees are undertaking, such as data on the total number of hours spent by FTEs on validating employment information provided by applicants, maintaining EI web applications and performing market research to anticipate employment trends. The program outputs refer to the results that followed activities, such as data on the number of newly approved EI recipients, the number of newly approved prescription drugs and the number of requests closed.
The following diagram illustrates the interrelation between the inputs, activities, outputs and performance of a program from a PMR perspective.
Design and analysis of key performance indicators
In PMR, the notion of performance depends on the intended results a program was designed to achieve. One must pinpoint and understand the intended results of a program to be able to measure its performance. If a program’s intended results are vague or unknown, then its performance cannot be measured. In addition, over its lifespan, a program may not achieve its intended results due to continuous resource constraints or adverse events that disrupt its operations.
Using the EI program example noted earlier, the intended result of this program is that all qualified individuals in the population have timely access to benefits that cover their cost of living in the event of a job loss. Although it may be impossible to ensure that all qualified individuals in a population have access to benefits, the program continuously operates with the overarching goal of being close to, or reaching, this intended result.
Performance measurement is a quantification of the progress of a program towards its indented results. High performance indicates that a program’s measured results are close to the intended results. Low performance indicates that a program’s measured results are far less than the intended results. Measuring performance allows decision makers to continuously assess whether a program is achieving its intended results or falling short of its intended results.
Using the EI program example noted earlier, this program was designed to offer individuals financial support during job loss. As a result, one can measure the performance of such a program by comparing the number of individuals who experienced job loss and received financial support to the total number of individuals who experienced job loss. Intuitively, the program is performing well if most individuals who experienced job loss receive financial support. And the program is not performing well if most individuals who experience job loss do not receive financial support (i.e., the program is not offering support to its intended recipients.)
A key performance indicator (KPI) is a type of statistic that measures the performance of a program over a specific time period. A KPI is the single-most important statistic produced by PMR as it precisely quantifies the performance of a program in a single number, based on the collected raw data corresponding to a specific time period. Through comparing KPI measures over consecutive reporting periods, one can identify whether performance is decreasing or increasing over time. And differences between KPI measures of different reporting periods allow for quantifying the amounts by which performance decreased or increased over time.
As an example for designing a KPI, consider a government program that was created to process and respond to requests for information from the public. The intended result of the program is to respond to all requests from the public within 45 days. Therefore, a KPI measures the performance of the program in terms of its ability to respond to all requests within 45 days.
A possible KPI for this example would be to compute the proportion of requests responded to within 45 days. For example, if the program received 3,000 requests in a specific time period, but processed and closed only 2,400 requests within 45 days, then the program’s KPI is 80% (2,400 divided by 3,000). An interpretation of this KPI is that the program completed 80% of its requests on time, and it did not complete 20% of its requests on time.
A program’s KPI can be compared to the program’s intended result to identify performance issues. In the preceding example, the computed KPI was 80%, and the program’s intended results is to respond to 100% of requests on time. One might ask why did the program fall 20% short of its 100% target to respond to all requests within 45 days?
Although the computation of a KPI is mathematically simple, the challenge often faced by organizations lies in the design of an appropriate KPI equation that precisely quantifies performance based on the program’s intended results and collected data.
To produce good KPIs, one can ensure that the following properties are met:
- Clear: the KPI must be in specific and plain language.
- Valid: the KPI must measure progress related to a program’s intended results.
- Available: the indicator must be based on data variables that are readily and continuously available.
- Stability: the method for computing the KPI must be stable over time to enable trend analysis for identification of performance issues.
Visualizing program data
PMR analyzes data on the inputs, activities, outputs, and performance of a program through utilizing tools of descriptive statistics. On the numerical front, PMR utilizes counts, sums, proportions, averages, percentage changes, and rates. On the graphical front, PMR utilizes line charts, different types of bar charts, pie charts and other types of visualizations.
In PMR, statistics corresponding to one reporting period may not contain any valuable information. Valuable information is often gleaned from patterns identified over time in visualizations. To build visualizations that can present valuable information, one must have a sound understanding of a program’s inputs, activities, outputs and performance from qualitative and quantitative perspectives. In addition, one must have program data that correspond to at least 3 to 5 reporting periods to allow for building visualizations that present trends over time.
From a qualitative perspective, one must understand the structure and components of a program, its core processes, what constitutes its inputs, activities, outputs and performance and how they are linked to each other. From a quantitative perspective, one must understand the structure of the raw data representing a program, the definitions and measurement units of all the data variables, and the knowledge to classify all the data variables into the various program data components — inputs, activities, outputs, and performance.
Visualizations are built to answer questions, by decision makers, on changes to inputs, activities, outputs and performance over consecutive reporting periods. Given the complexity and interrelation of program data, visuals are often the most effective way to summarize the data to decision makers and to generate new information through uncovering previously unknown patterns within the data.
The types of patterns visuals can uncover include increases or decreases in a data variable over time, changes in the disposition of a data variable with respect to another, and identification of outlier observations that influence trends over time.
For example, the visualization below presents a pattern in which the number of requests closed, a program output, has been increasing over five consecutive fiscal years.
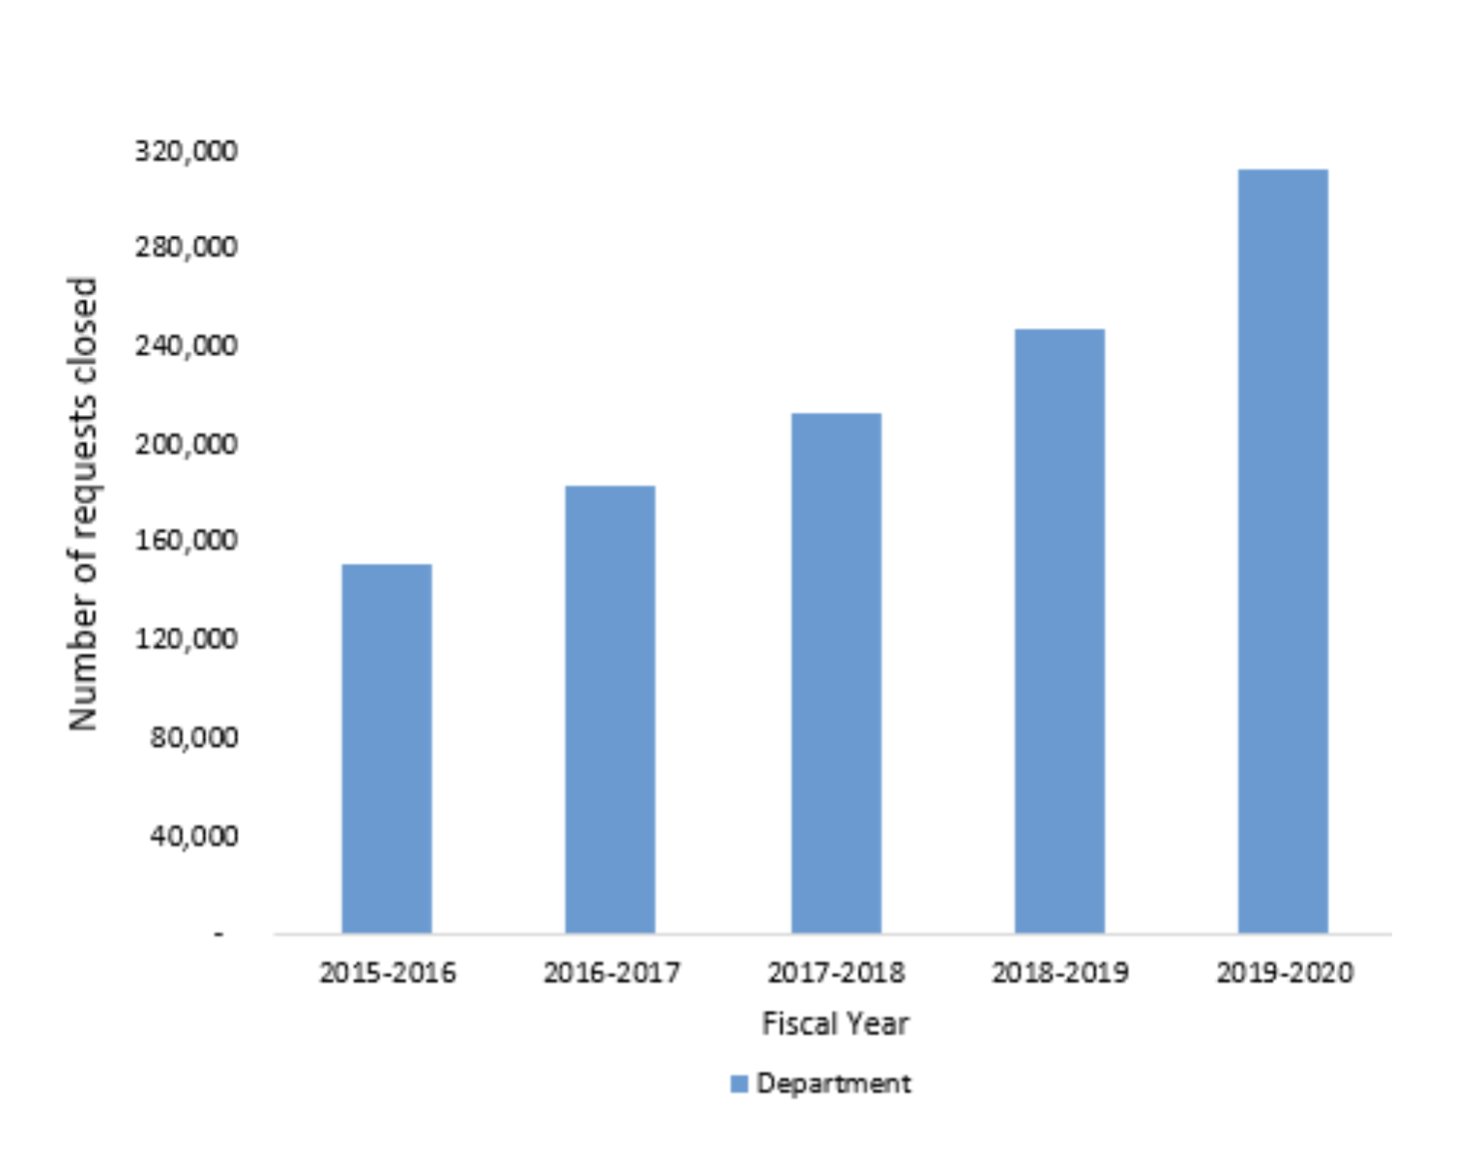
If trends are identified in a visualization, such as the figure above, one can disaggregate the data to identify possible causes of the patterns. As an example, given the trend that was identified in the number of requests closed over time, the data was filtered by business unit to identify the units that experienced the trend and the units that did not experience the trend, as shown by the figure below.
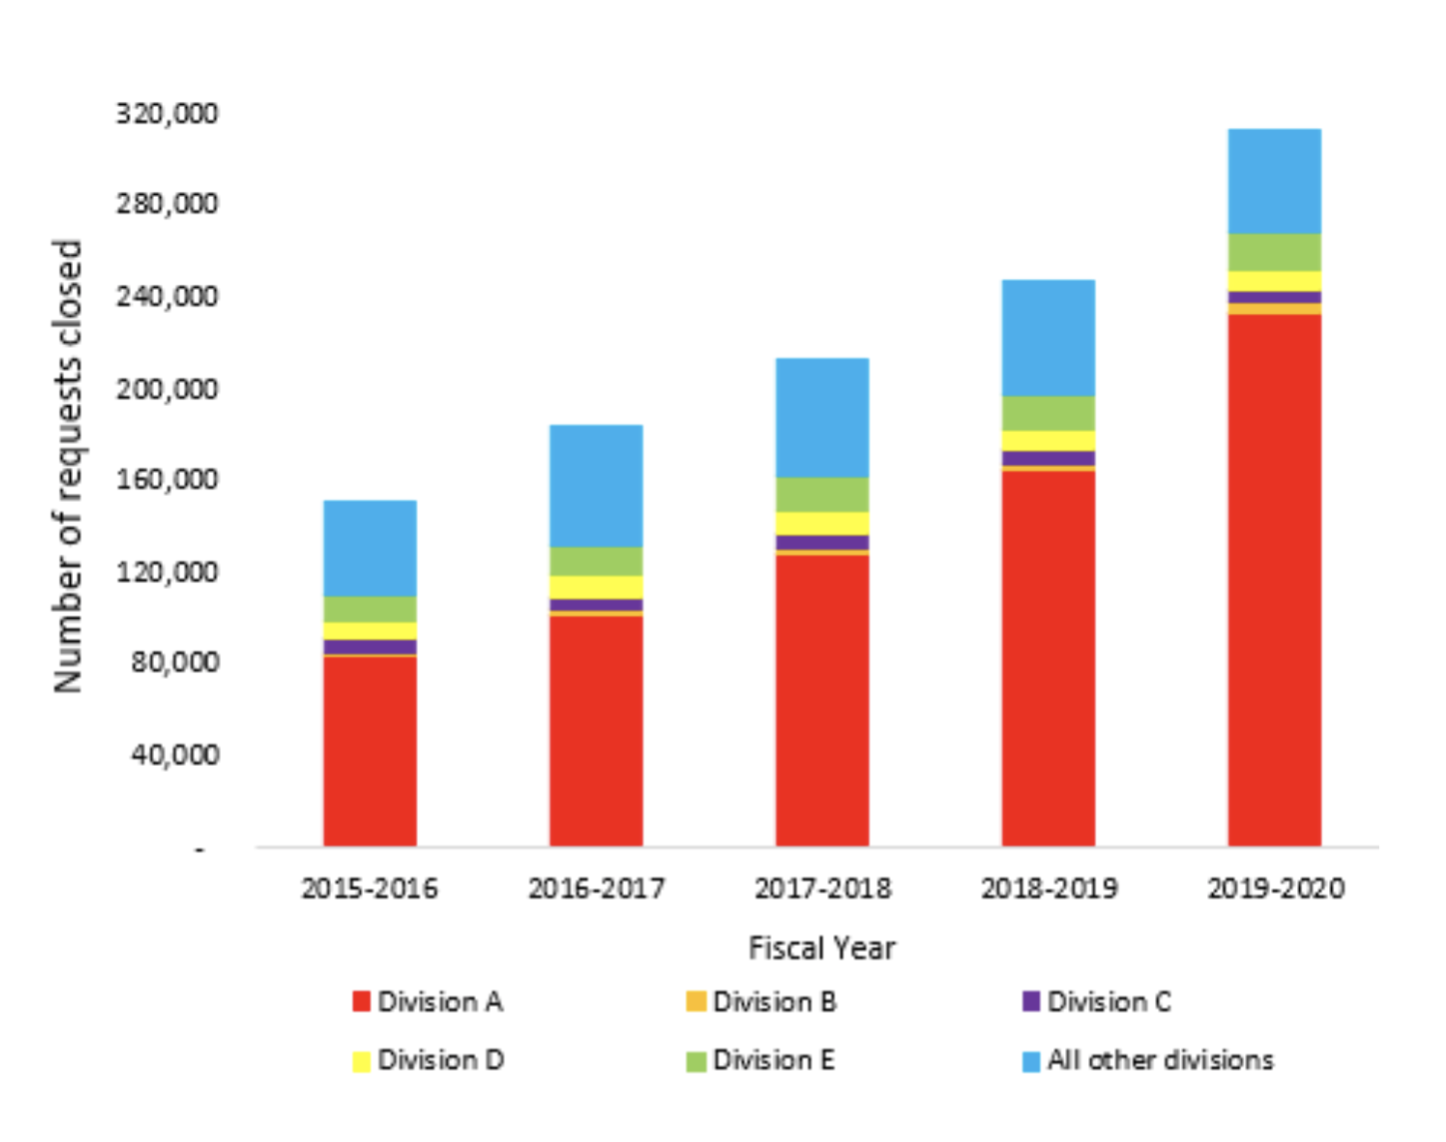
The figure above illustrates that most of the increase in the number of requests closed has been driven by the business unit Division A of the organization. It is a good practice to continuously confirm trends identified in program data visuals by disaggregating the trend into different groups to validate if the trends exist across all the different segments of program data.
Reporting of program data
The end product of a PMR process is a performance report that presents descriptive statistics on the inputs, activities, outputs and performance of a particular program within a specific reporting period (e.g., fiscal year April 1, 2019, to March 31, 2020.)
Performance reports allow decision makers to continuously examine the performance of programs over different time periods to ensure that performance statistics are meeting or surpassing the set targets. And to continuously assess the financial, human resources and workload capacity of programs.